This tutorial introduces the Solana BPF (sBPF) memory layout and the roles of its virtual machine registers. We’ll demonstrate the conventions for how programs read and write data from memory into registers within the sBPF VM.
Solana BPF memory layout
The sBPF VM’s memory is divided into 5 distinct regions. Each of the five regions serve a specific purpose. Any attempt to access memory outside these regions, or to violate a region’s permissions such as writing to read-only data, triggers an access-violation error. Will show this later.
Before we describe each region, we want to emphasize that while the EVM reads it’s bytecode directly from the contract code, the SVM loads its bytecode into memory before running it.
The addresses below are the start of each memory region and are defined in the Solana source code as u64 constants. The names such as MM_BYTECODE_START, MM_RODATA_START, etc., are the Rust constants definitions starting address of each region. MM here means “memory map” while RO means “read-only”. Solana reserves 4GiB for each of these memory regions to prevent address collisions between regions but allocates the size each region actually needs.
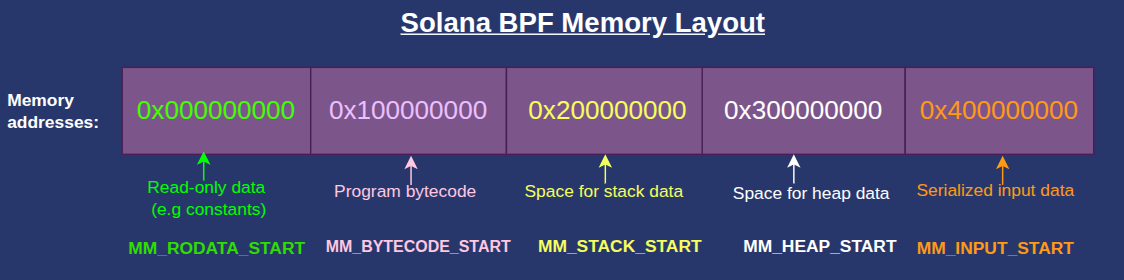
0x000000000:MM_RODATA_START— 4 GiB for the read-only ELF data (constants, static data)0x100000000:MM_BYTECODE_START— 4 GiB for the program bytecode region0x200000000:MM_STACK_START— 4 GiB for the execution stack0x300000000:MM_HEAP_START— 4 GiB reserved for heap memory region0x400000000:MM_INPUT_START— 4 GiB for the serialized input data (program id, accounts, and instruction data) in the current transaction. This is populated by the runtime at the start of the program.
The Solana BPF memory layout can be visualized as shown below:
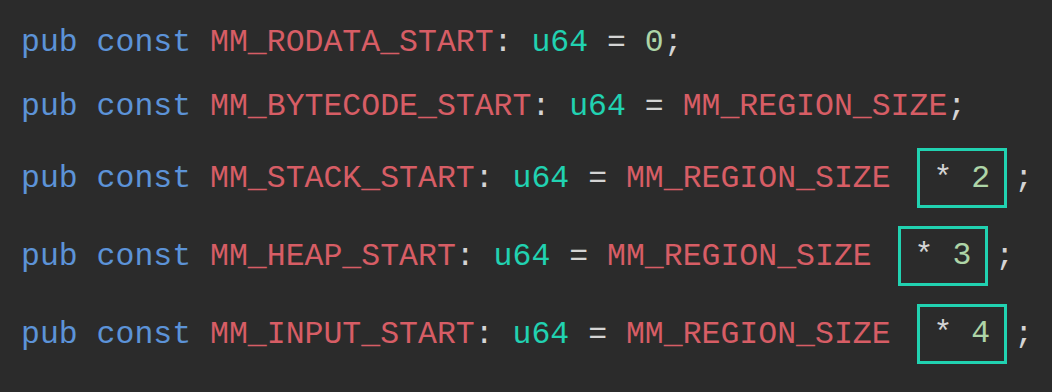
The Solana client defines the constants as shown in the snippet below:
pub const MM_RODATA_START: u64 = 0;
pub const MM_BYTECODE_START: u64 = MM_REGION_SIZE; // = MM_REGION_SIZE * 1
pub const MM_STACK_START: u64 = MM_REGION_SIZE * 2;
pub const MM_HEAP_START: u64 = MM_REGION_SIZE * 3;
pub const MM_INPUT_START: u64 = MM_REGION_SIZE * 4;
MM_REGION_SIZE defines the size of one virtual memory block, calculated as 1 << VIRTUAL_ADDRESS_BITS. The VIRTUAL_ADDRESS_BITS is defined as 32 in the sBPF source code, this means within each region, there are 2^32 different byte addresses, which gives each region 4GiB of addressable space.
The multipliers (* 2, * 3, * 4) advance each region’s starting address by multiples of MM_REGION_SIZE.
To use data in memory, we must first load it into a register. The VM assigns each register a specific role, which developers are expected to follow by convention. The next section describes these roles with minimal examples.
How the Solana BPF VM assigns roles to registers
The sBPF VM has 12 registers, named r0 through r11. Registers r0–r10 are exposed to programs, while r11 holds the program counter and is both not readable and not writable by Solana programs.
r0 holds return values, r1–r5 are argument registers, r6–r9 are general-purpose scratch registers also known as callee-saved registers (use for storing temporary values across calls), and r10 is the frame pointer register for the current call stack.

Before we examine each register, let’s set up an environment to observe how register values change during execution.
Register experiment setup
Create a new folder named register-experiment. Open a terminal inside this folder and run the solana-test-validator command. This will start a local Solana cluster and create a test-ledger directory inside register-experiment
Once the local validator is running:
- Create a folder named
srcin theregister-experimentdirectory. This folder will hold our assembly program and a trace file showing how register states change after each instruction executes. - Create a
src/inputs.asmfile for our assembly code.
Your directory should look like this:
register-experiment
├── src
└── inputs.asm
We’ll use the agave-ledger-tool (which comes with your Solana installation) to run our assembly code and create register traces.
Use the command below to run the following examples. It runs against our local test ledger, executes the assembly program with a 200,000 compute-unit limit, and generates a trace file showing how register values change during execution.
agave-ledger-tool program run src/inputs.asm --limit 200000 --trace src/trace.txt --ledger test-ledger
Note: On some architectures, such as Apple Silicon, running this command may trigger a JitNotCompiled error. To resolve this, add the --mode interpreter flag to force interpretation instead of JIT compilation.
Now that our setup is complete, we’ll demonstrate how each register, from r0 through r11, is used during execution. Our demonstrations hardcode values into registers to isolate their behavior. We’ll show how to read from memory and load values into registers in the next article.
Register r0
Programs communicate success or failure to the runtime by writing to r0. The VM reads this value when execution completes. The possible outcomes are:
- A successful execution returns
0. - A controlled error returns a non-zero error code (we write the custom error code).
- If panic happens, the program terminates before reaching the exit instruction, so the runtime ignores
r0.
Let’s demonstrate how programs communicate success or failure using r0 based on the three possible outcomes listed above.
1/3 An example showing successful execution returns 0
Write a simple exit instruction in src/inputs.asm:
exit
Run it with the agave-ledger-tool command, you’ll get a successful exit returning 0:
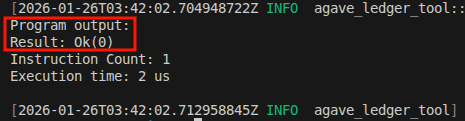
The following trace will be created in trace.txt showing that the r0 is 0000000000000000 (the first column in the trace is r0, the second is r1 …):
Frame 0
0 [0000000000000000, 0000000400000000, ...] 0: exit
The above demonstration shows that r0 holds 0 if a function returns successfully.
2/3 An example to show a controlled failure returns a nonzero value.
We can write to r0 in case of a controlled failure. If we for some reasons we want to return a custom error code like 600 (0x0000000000000258), the program still exits cleanly, but r0 holds the error code instead of zero:
mov r0, 600 ; Set custom error code
exit
The comments in the assembly code examples may cause a parse error when copied directly, because the agave-ledger-tool throws errors if there are comments. Delete the comment ; Set custom error code if this happens.
Run the above code using the agave-ledger-tool, you’ll get this output:
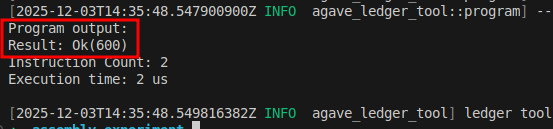
The trace shows that r0 started at 0 and its current state is 0000000000000258 in hex which is 600 in decimal:
Frame 0
0 [0000000000000000, 0000000400000000, 0000000000000000, 0000000000000000, 0000000000000000, 0000000000000000, 0000000000000000, 0000000000000000, 0000000000000000, 0000000000000000, 0000000200001000] 0: lddw r0, 0x258
1 [0000000000000258, 0000000400000000, 0000000000000000, 0000000000000000, 0000000000000000, 0000000000000000, 0000000000000000, 0000000000000000, 0000000000000000, 0000000000000000, 0000000200001000] 2: exit
3/3 An example to show that a panic or trap terminates execution and doesn’t write to r0
A panic or trap terminates execution and is treated as unrecoverable. It doesn’t store the result in r0, so any value previously stored there is ignored.
The code below demonstrates an attempt to write 42 to the read-only memory region.
lddw r1, 0x000000000 ;Load MM_RODATA_START address into r1
stdw [r1 + 0], 42 ;Attempt to store 42 into the MM_RODATA_START
exit
In the above code:
lddwloads a 64-bit immediate value into a register. We use it to load the read-only region’s start address (0x000000000) intor1.stdwstores a 64-bit immediate value directly to memory. We attempts to write 42 to the read-only memory region using this instruction, which triggers an access violation error when we run it.
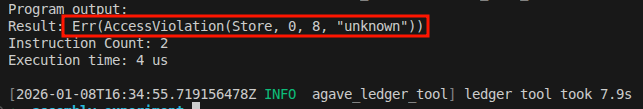
In the trace, you’ll notice that the trace ends at line 1 (the stxdw line) because we are attempting an invalid memory operation, which caused it to trap. The program never reached the exit instruction.
Frame 0
0 [0000000000000000, 0000000400000000, ...] 0: lddw r1, 0x100000000
1 [0000000000000000, 0000000100000000, ...] 2: stxdw [r1+0x0], r2
So far, we’ve covered how r0 behaves in different scenarios and how the VM uses it. At the Rust layer, the return value appears as Ok(u64) or Err(...), but in the VM it is just a single u64 status code stored in and read from r0.
The table below shows what happens in each scenario and the value that r0 holds in that scenario:
| Situation | What happens | Value in r0 |
|---|---|---|
| Normal return | Program finishes and returns to the loader | 0 |
| Controlled error (Anchor or manual error handling) | Program sets an error code, and returns | Non-zero error code (e.g; 2, 600, 1, 5, etc) |
| Assertion failure or abort | Program terminates | r0 is ignored because the program doesn’t reach the exit instruction |
Register r1
At program start, r1 holds MM_INPUT_START (0x400000000), which points to the beginning of the serialized input parameters in memory.
Assume we have a function that takes two arguments, a and b:
fn add_constant(a: u64, b: u64)
When the program begins execution, the runtime stores the serialized values of a and b in the memory location MM_INPUT_START. At this stage, the register r1 points to MM_INPUT_START (that is, r1 contains the address of MM_INPUT_START).
During execution, the role of r1 changes to an argument register and the content can be overwritten by the program.
Registers r1-r5
If your program’s functions need arguments during execution, the runtime expects your program to store those arguments in r1 through r5. If a function needs more than five arguments, you must store the extra values on the stack and pass a pointer to them using one of these registers.
When a function returns, the values in argument registers are considered dirty. The next function that executes may overwrite r1–r5 freely.
Let’s demonstrate argument passing by calling an add_numbers function that takes two arguments.
fn add_numbers(a: u64, b: u64) -> u64 {
a + b
}
For simplicity, we manually translate the above code into sBPF assembly and bypass the compiler. The snippet is shown below. Let’s pass 10 as the first argument and 25 as the second, add them in the function body, and return the result in r0:
mov r1, 10 ; Simulate passing a=10 as first argument
mov r2, 25 ; Simulate passing b=25 as second argument
add64 r1, r2 ; Function body: add first and second argument
mov r3, r1 ; Copy the result to r3
exit ; exit successfuly with 0 in r0
Run the agave-ledger-tool and check the trace.txt file. You’ll see that the result is 23 (35 in decimal):

The next registers are r6-r9, but they depend on r10 (the stack pointer). Let’s explain r10 first, then return to r6-r9.
The Stack Pointer Register (r10)
r10 is the stack frame pointer. It holds a virtual address pointing into the current stack region.
When your program starts, the runtime initializes r10 to MM_STACK_START + stack_frame_size, where MM_STACK_START is**0x200000000**while stack_frame_size = 4096 (1000 in hex) bytes (4KiB) — in traces, you’ll see r10 initialized as 0x200001000. This puts r10 at the top of your stack frame with a 4096 bytes of usable space below it.
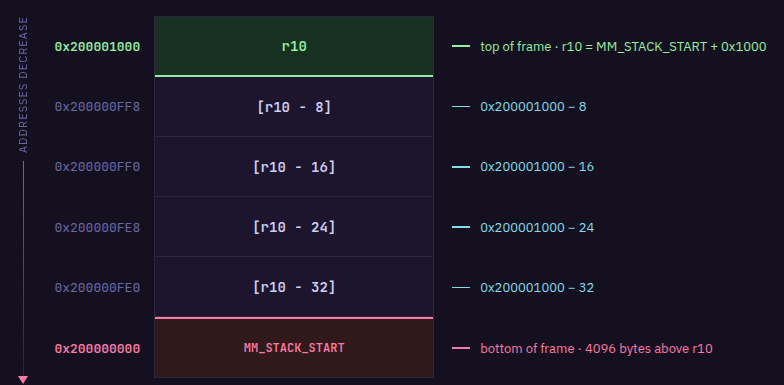
The stack grows downward, meaning you allocate stack space at progressively lower memory addresses. Since r10 = MM_STACK_START + stack_frame_size, reading from or writing to any stack location follows this formula:
[r10 - offset] = MM_STACK_START + stack_frame_size - offset
where offset is the number of bytes of stack space consumed. That means [r10 - 8] resolves to MM_STACK_START + stack_frame_size - 8, you’re referencing a location 8 bytes below where r10 points.
So r10 itself never changes value as your program executes. To use more stack space, you simply use larger offsets like [r10 - 16], [r10 - 24], and so on. Each function call is limited to 4KiB (4096 bytes) of usable space.
Let’s say you need to pass data on the stack to a function. You choose a location in the stack frame at some negative offset from r10, write your data there, then put the address of that location (for example, r10 - 8) into one of the argument registers (r1 through r5) before calling.
For example, if you need a 64-byte buffer as the first argument:
- You can store data in the memory region
[r10 - 64]to[r10 - 1] - You move the starting address
r10 - 64intor1
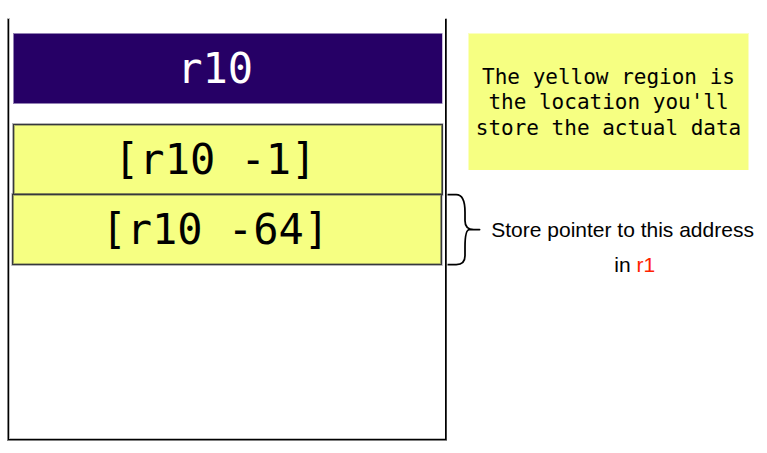
- Then you make your function call
We’ll demonstrate how to use the r10 stack pointer when we cover “Registers 6-9”.
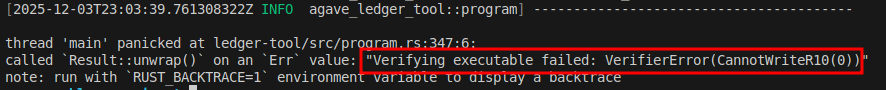
Write restrictions on r10
You can’t write to the r10 register. Writing to r10 with mov returns an error:
mov r10, 999 # Error: cannot write to r10
exit
Attempting to write to r10 with add r10, -64 doesn’t error, but the VM silently ignores it and rewrites the instruction to a 64-bit bitwise OR instruction (or64 r0, 0) that does nothing:
add r10, -64
exit
If we run the code above and look at the trace file, we’ll see that r10 remains unchanged:

Callee-saved Registers (r6-r9)
In Solana BPF, registers r6-r9 are ‘callee-saved’ (also called ‘preserved’). This means if a function (the callee) modifies these registers, it must restore them to their original values before returning to the caller.
For example, if function A stores a value in r6 and calls function B, and function B wants to use r6 for it’s own computation, function B must preserve whatever was in r6 before using it. Function B does this by copying r6 to the stack, using r6 for its own computation, then copying the original value back from the stack into r6 before returning. When function B exits, function A still holds its original value in r6.
The code below demonstrates the data preservation convention between two functions:
- Function A (CALLER) stores 999 in
r6 - Function A calls function B (
function_b), expectingr6to be preserved - Function B copies
r6(999) to the stack at[r10 - 8] - Function B uses
r6for its own computation: loads 42 and adds 10 (resulting in 52) - Function B restores
r6from the stack back to 999 before returning - When function B exits, function A still holds 999 in
r6 - Function A moves
r6tor2to use the preserved value
; === Function A: CALLER ===
mov r6, 999 ; Store value we want preserved across call
call function_b ; function_b MUST preserve r6 per convention
mov r2, r6 ; r6 still contains 999 (preserved by callee)
exit
; === Function B: CALLEE ===
function_b:
; Save callee-saved registers we'll modify
stxdw [r10 - 8], r6 ; copy caller's r6 value to stack
; FUNCTION BODY: We can freely use r6 now
mov r6, 42 ; Temporary use of r6
add64 r6, 10 ; r6 = 52 (will be discarded)
; Restore callee-saved registers
ldxdw r6, [r10 - 8] ; Restore original r6 value (999)
exit
The animation below illustrates these steps:
Running the above code produces the trace below:
Frame 0
0 [..., 0000000400000000, 0000000000000000, ..., ..., ..., 0000000000000000, ..., ..., ..., 0000000200001000] 0: mov64 r6, 999
1 [..., 0000000400000000, 0000000000000000, ..., ..., ..., 00000000000003E7, ..., ..., ..., 0000000200001000] 1: call function_b
2 [..., 0000000400000000, 0000000000000000, ..., ..., ..., 00000000000003E7, ..., ..., ..., 0000000200003000] 4: stxdw [r10-0x8], r6
3 [..., 0000000400000000, 0000000000000000, ..., ..., ..., 00000000000003E7, ..., ..., ..., 0000000200003000] 5: mov64 r6, 42
4 [..., 0000000400000000, 0000000000000000, ..., ..., ..., 000000000000002A, ..., ..., ..., 0000000200003000] 6: add64 r6, 10
5 [..., 0000000400000000, 0000000000000000, ..., ..., ..., 0000000000000034, ..., ..., ..., 0000000200003000] 7: ldxdw r6, [r10-0x8]
6 [..., 0000000400000000, 0000000000000000, ..., ..., ..., 00000000000003E7, ..., ..., ..., 0000000200003000] 8: exit
7 [..., 0000000400000000, 0000000000000000, ..., ..., ..., 00000000000003E7, ..., ..., ..., 0000000200001000] 2: mov64 r2, r6
8 [..., 0000000400000000, 00000000000003E7, ..., ..., ..., 00000000000003E7, ..., ..., ..., 0000000200001000] 3: exit
Key observations from the trace:
- Line 1:
r6contains0x3E7(999) before the call - Line 2: The
callinstruction transitions tofunction_band updatesr10to
point to a new stack frame at0x200003000 - Line 4: After
mov64 r6, 42,r6contains0x2A(42) - Line 5: After
add64 r6, 10,r6contains0x34(52) - Line 6: After
ldxdw r6, [r10-0x8],r6is restored to0x3E7(999) - Line 7: After returning to the caller,
r10returns to0x200001000andr6still contains0x3E7(999) - Line 8: After
mov64 r2, r6, bothr2andr6contain0x3E7(999)
The animation below explains the above steps:
In the next part of this article, we’ll further demonstrate how to read and write the instruction inputs to memory by writing simple raw assembly programs that directly inspect memory contents.
This article is part of a tutorial series on Solana development