This article explains what ticks are in Uniswap V3. Ticks enable gas-efficient accounting of concentrated liquidity, so let’s quickly review concentrated liquidity first.
Concentrated liquidity means that liquidity is not necessarily constant across the price curve like Uniswap V2. Liquidity providers can choose segments in the price curve to place their liquidity. The animation below illustrates the difference between the price curves of Uniswap V2 and Uniswap V3.
For example, in a ETH:USDC pool, if the price of ETH is USDC 2,000, a liquidity provider might choose to place their liquidity between USDC 1,800 and USDC 2,200, so they can capture more fees in the price range where they expect the assets to trade. In the illustration below, the segment between USDC 1800 and USDC 2200 has greater liquidity compared to other segments.
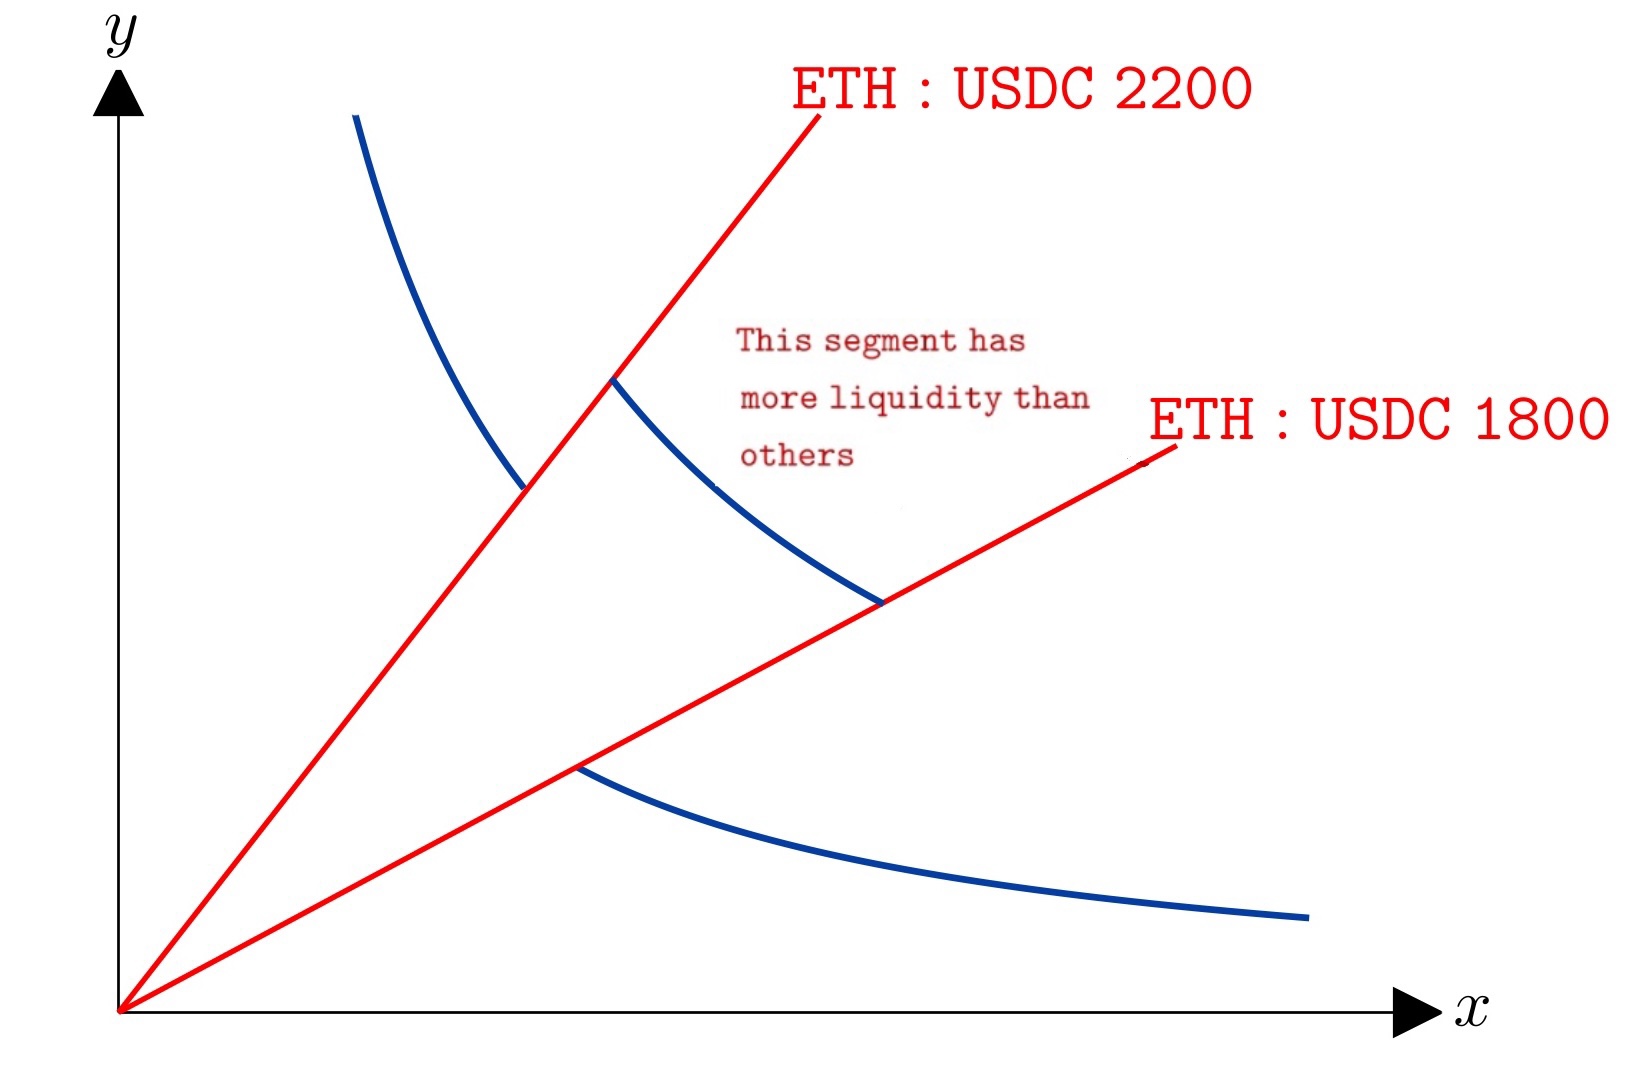
Higher liquidity within a range means the price impact of a swap in that range will be lower. Conversely, lower liquidity makes the price impact greater.
Introducing ticks and why they are necessary in Uniswap V3
In order to support concentrated liquidity, the Uniswap V3 protocol needs to model how liquidity varies along the price curve.
Liquidity can vary along the curve, but not at arbitrary points. If Uniswap v3 allowed liquidity to be modified at arbitrary points on the curve, complexity and gas costs would increase drastically. Any time the price moves even a tiny bit, the protocol would have to check if the liquidity changed.
Therefore, to significantly reduce the number of times we must check if liquidity changed, in Uniswap V3, liquidity can only be adjusted at predefined prices.
These predefined price points are called ticks. The figure below illustrates this concept, showing some of the ticks. Note that in Uniswap V3 there are far more ticks than those depicted below. The price curve is “sliced” by ticks (the red rays from the origin).
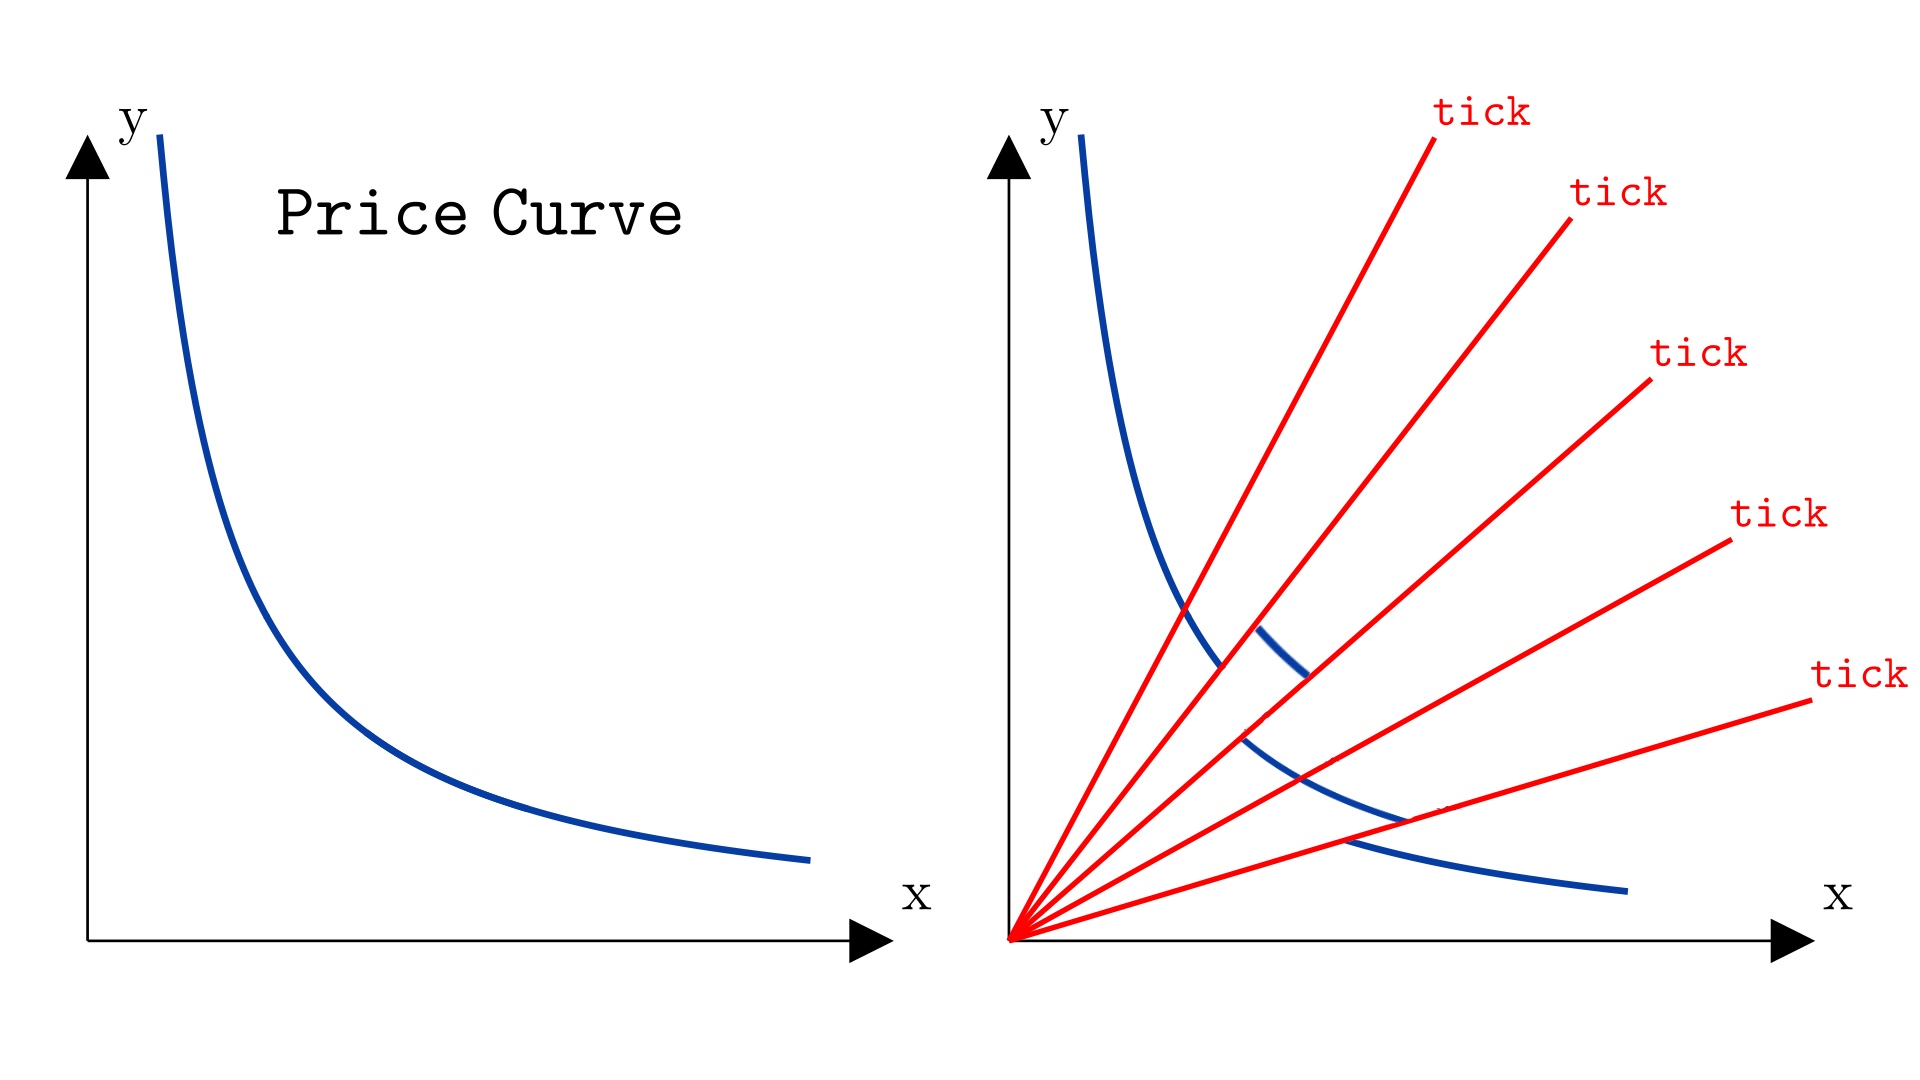
By way of review, “price” in Uniswap V2 and V3 can be interpreted as the angle of a ray from the origin to the price curve. The greater the “angle” from the x-axis, the higher the price of asset X in terms of asset Y. Therefore, ticks with a higher angle correspond to higher prices for asset X.
In the animation below, the angle of the cyan ray represents the price of asset X, while the red rays represent ticks. While the price of asset X can vary and take any value, ticks remain fixed.
It is important to understand that ticks represent points on the curve that will be used as labels. Let’s relate it to an analogy of a road with mileage markers. While a car can be anywhere along the road, the mile markers are placed at specific points, typically some predictable interval. Similarly, in Uniswap v3, token prices can have any value, but ticks are statically positioned at specific locations pre-defined by the protocol.
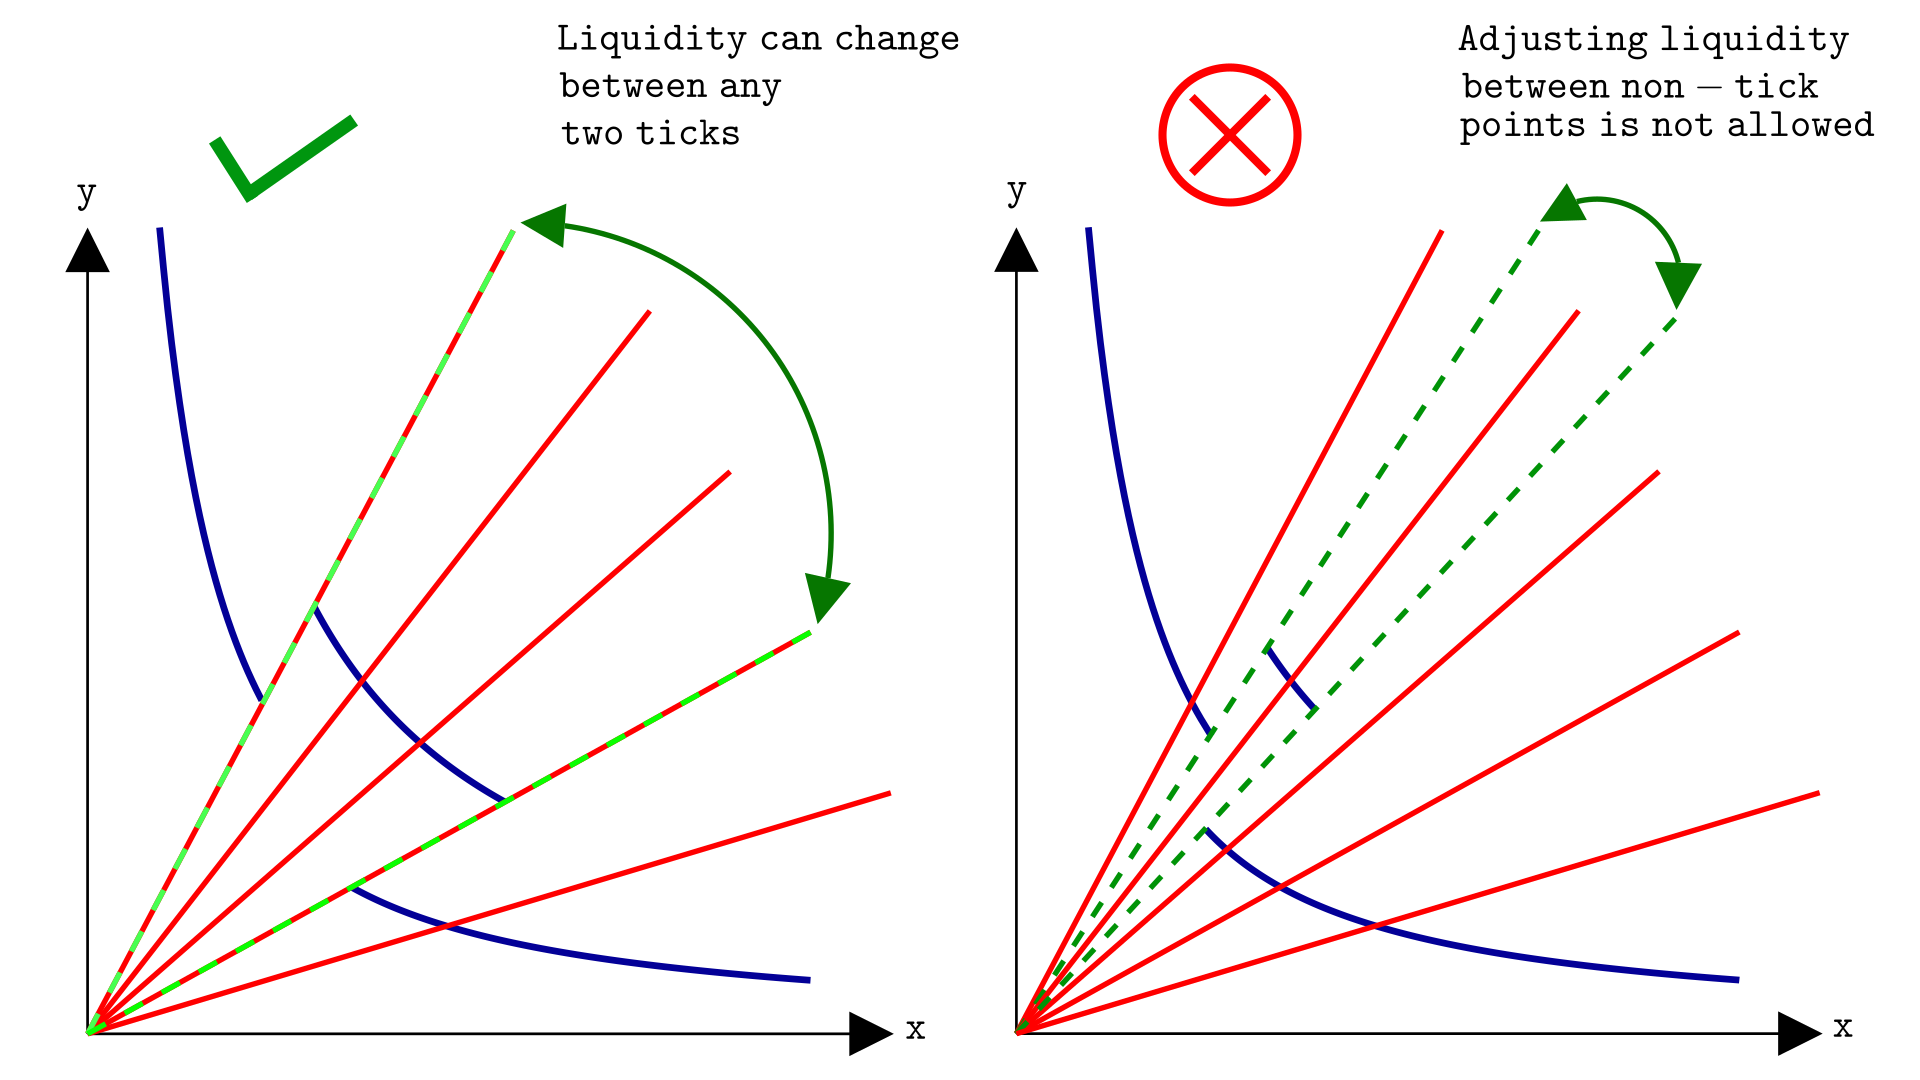
Ticks serve as reference points in the price curve for where liquidity can change.
We illustrate this concept below. The ticks are shown as red rays from the origin. On the left, liquidity is adjusted between ticks, which Uniswap V3 allows. On the right, the scenario depicts an attempt to adjust liquidity between points on the curve that are not ticks, which the protocol does not allow.
We will shortly show how Uniswap V3 determines where to place the ticks, but first let’s quickly review how “price” means the “price of token X in terms of Y.”
In Uniswap v3, we use the price of token X
In Uniswap v3, prices always refer to the price of token X in terms of token Y. Thus, anytime we write , it refers to the price of token X, given by .
The price of token Y in terms of token X, given by , can be calculated from as . Thus, the protocol just needs to keep track of the prices in X (). The prices in Y () can be calculated accordingly.
For instance, if the price of token X is , the price of token Y can be calculated as or . Choosing to work with prices in token X instead of token Y is merely a convention.
The tick to price formula
We said that ticks are pre-defined prices, but how are these prices defined?
They are defined by the following formula:
where is an integer named tick index and is the price that the tick index represents. We will refer to this as the “tick price”. Remember, each tick is simply a label for a fixed price.
Some examples of ticks are:
- Tick index 0 defines price 1:1, because .
- Tick index 1 defines price 1:1.0001, because .
- Tick index 2 defines price 1:1.00020001, because .
- Tick index -1 defines price approximately 1:0.99990001, because .
The allowed tick indexes range from -887,272 to 887,272, and the reason for this range will be explained in the next chapter.
It is common to refer to the index also as a tick and the codebase does this a lot. Referring to the tick index or the tick price should be clear from the context. In any case, each tick index is uniquely associated with a tick price and vice versa.
Examples of asset prices in relation to ticks
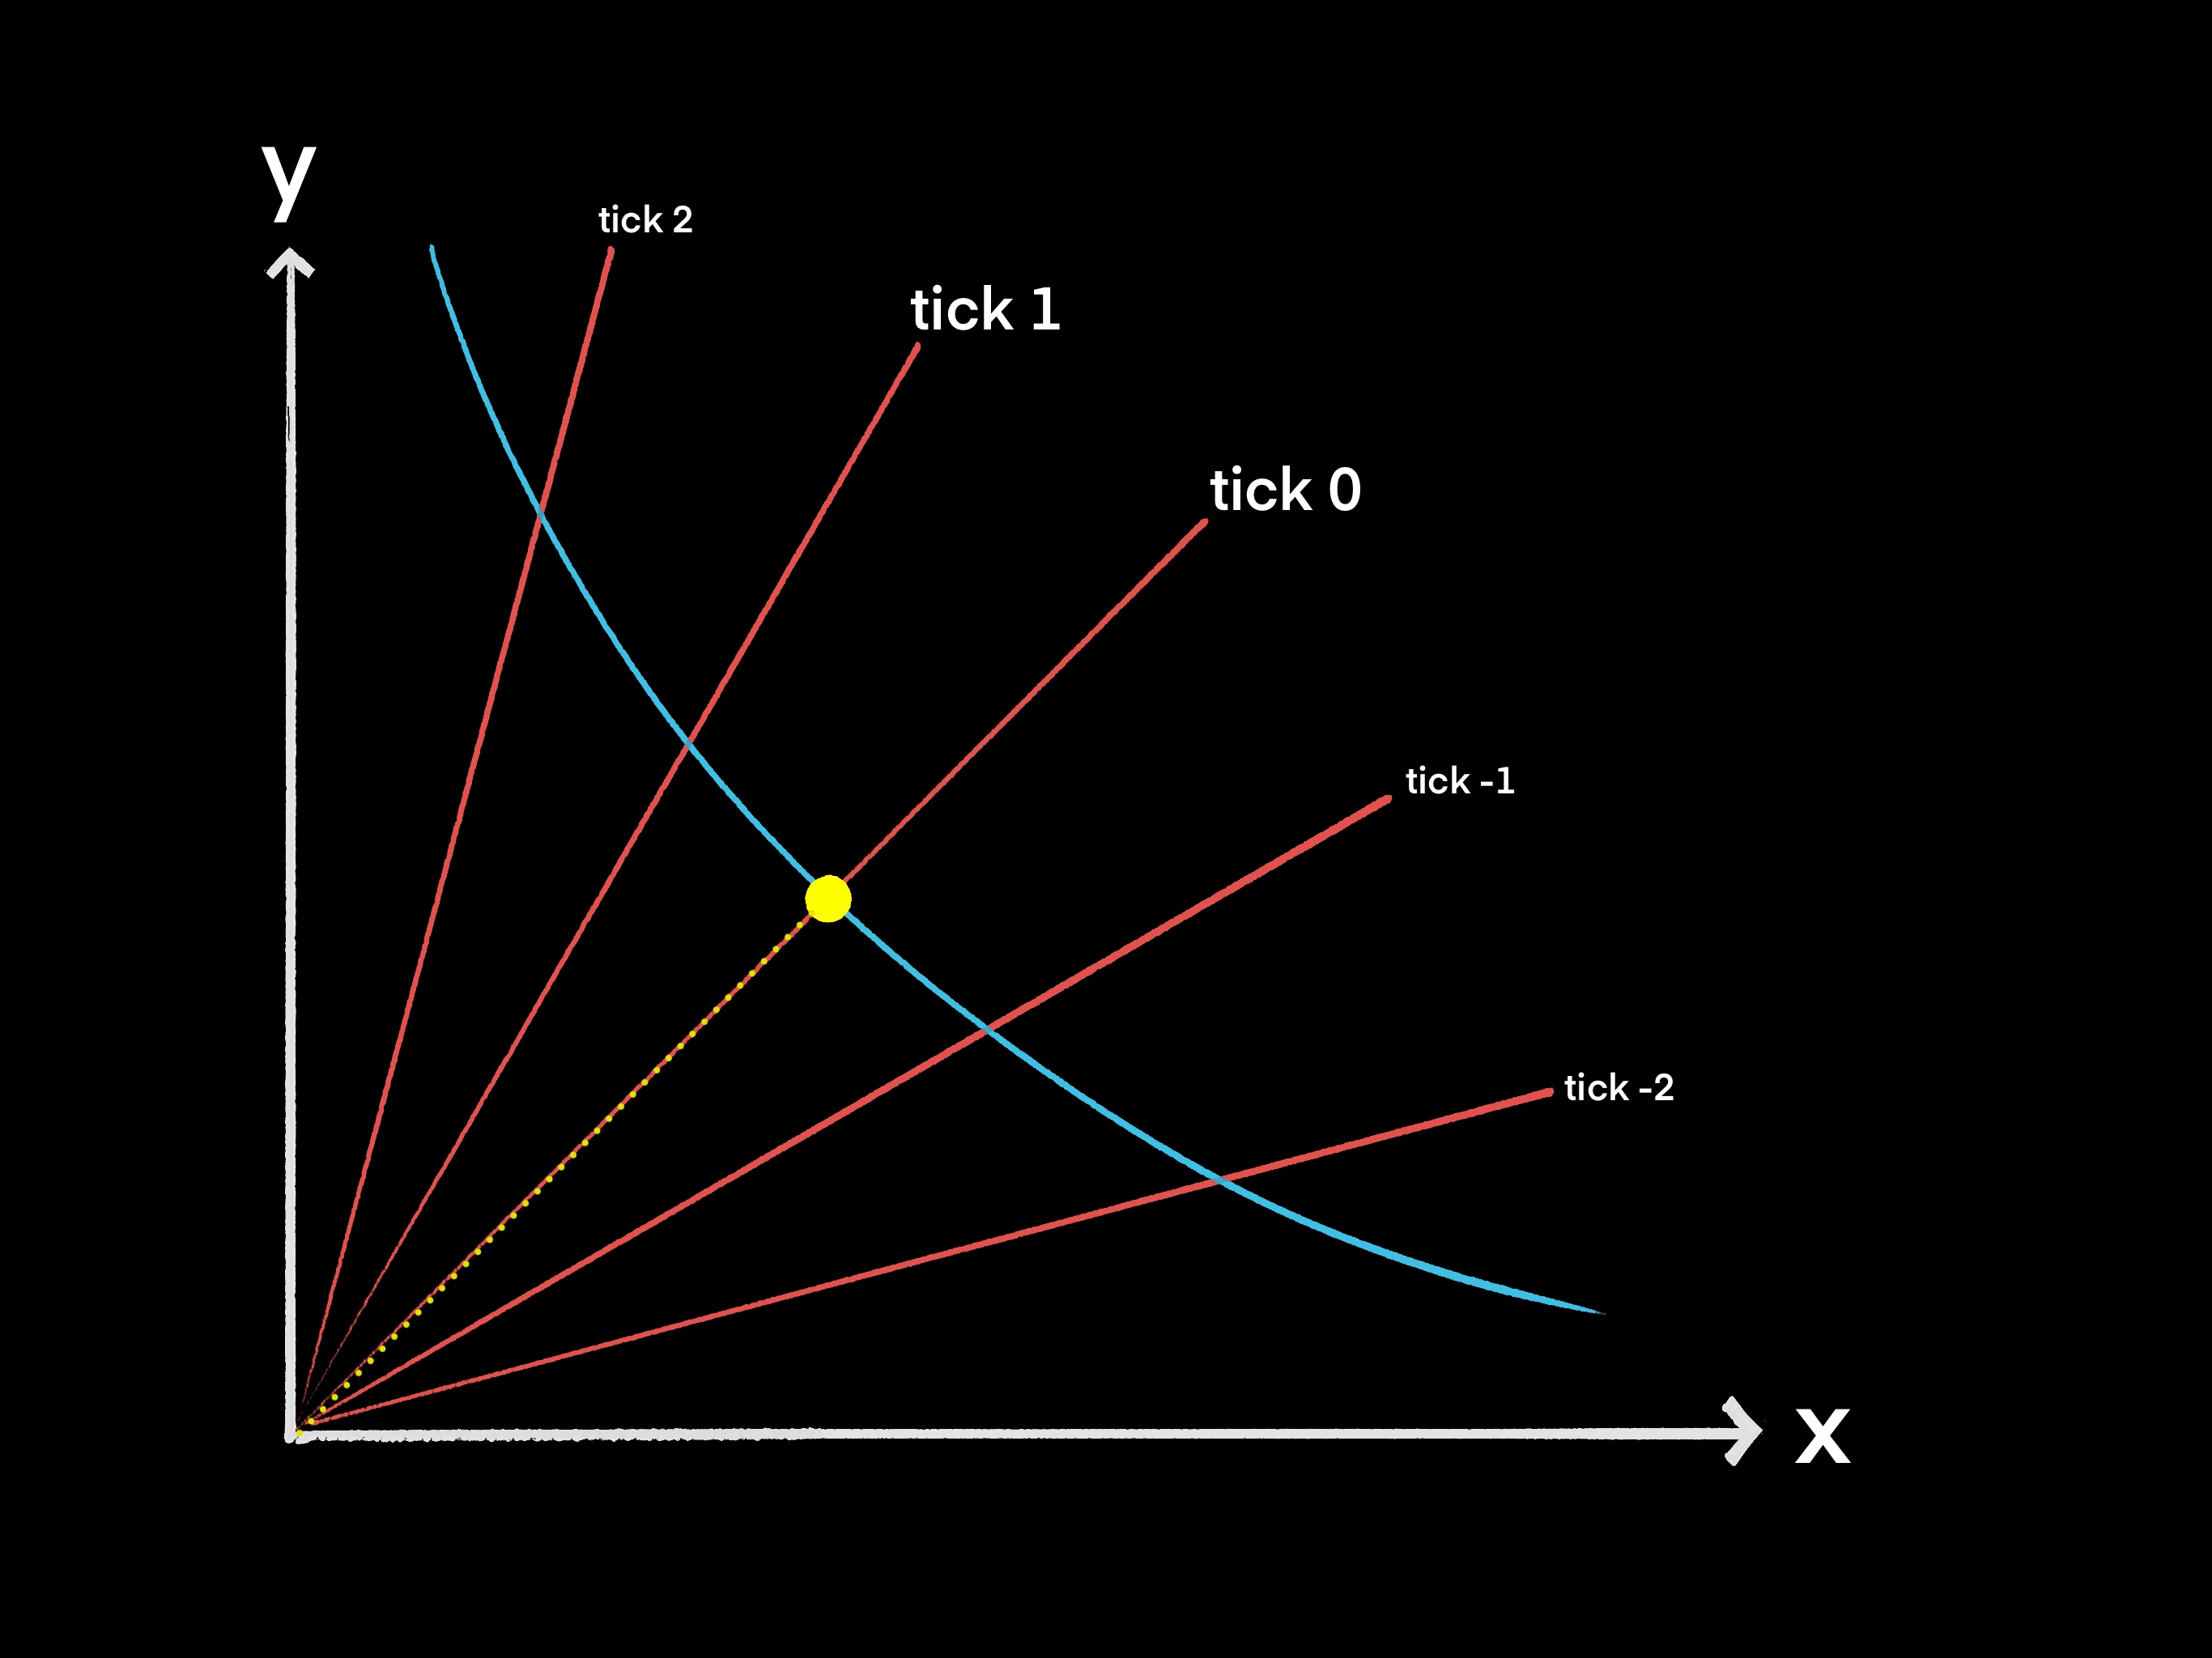
Suppose we have a USDC:USDT pool, where token X is USDC and token Y is USDT. If the two assets have exactly the same value, then the price will land exactly on tick index 0, because the price of USDC in terms of USDT is 1:1. This is illustrated below (ticks are not to scale). The ticks are represented with red rays, the price at which USDC trades with USDT is represented with a yellow dotted ray terminating at the yellow dot, and the price curve is the cyan curve:
Now suppose that USDC very slightly gains in value relative to USDT. That is, someone has to trade 1.00005 USDT to get one USDC. This would put the current price of USDC slightly above tick 0, but not quite at tick 1:
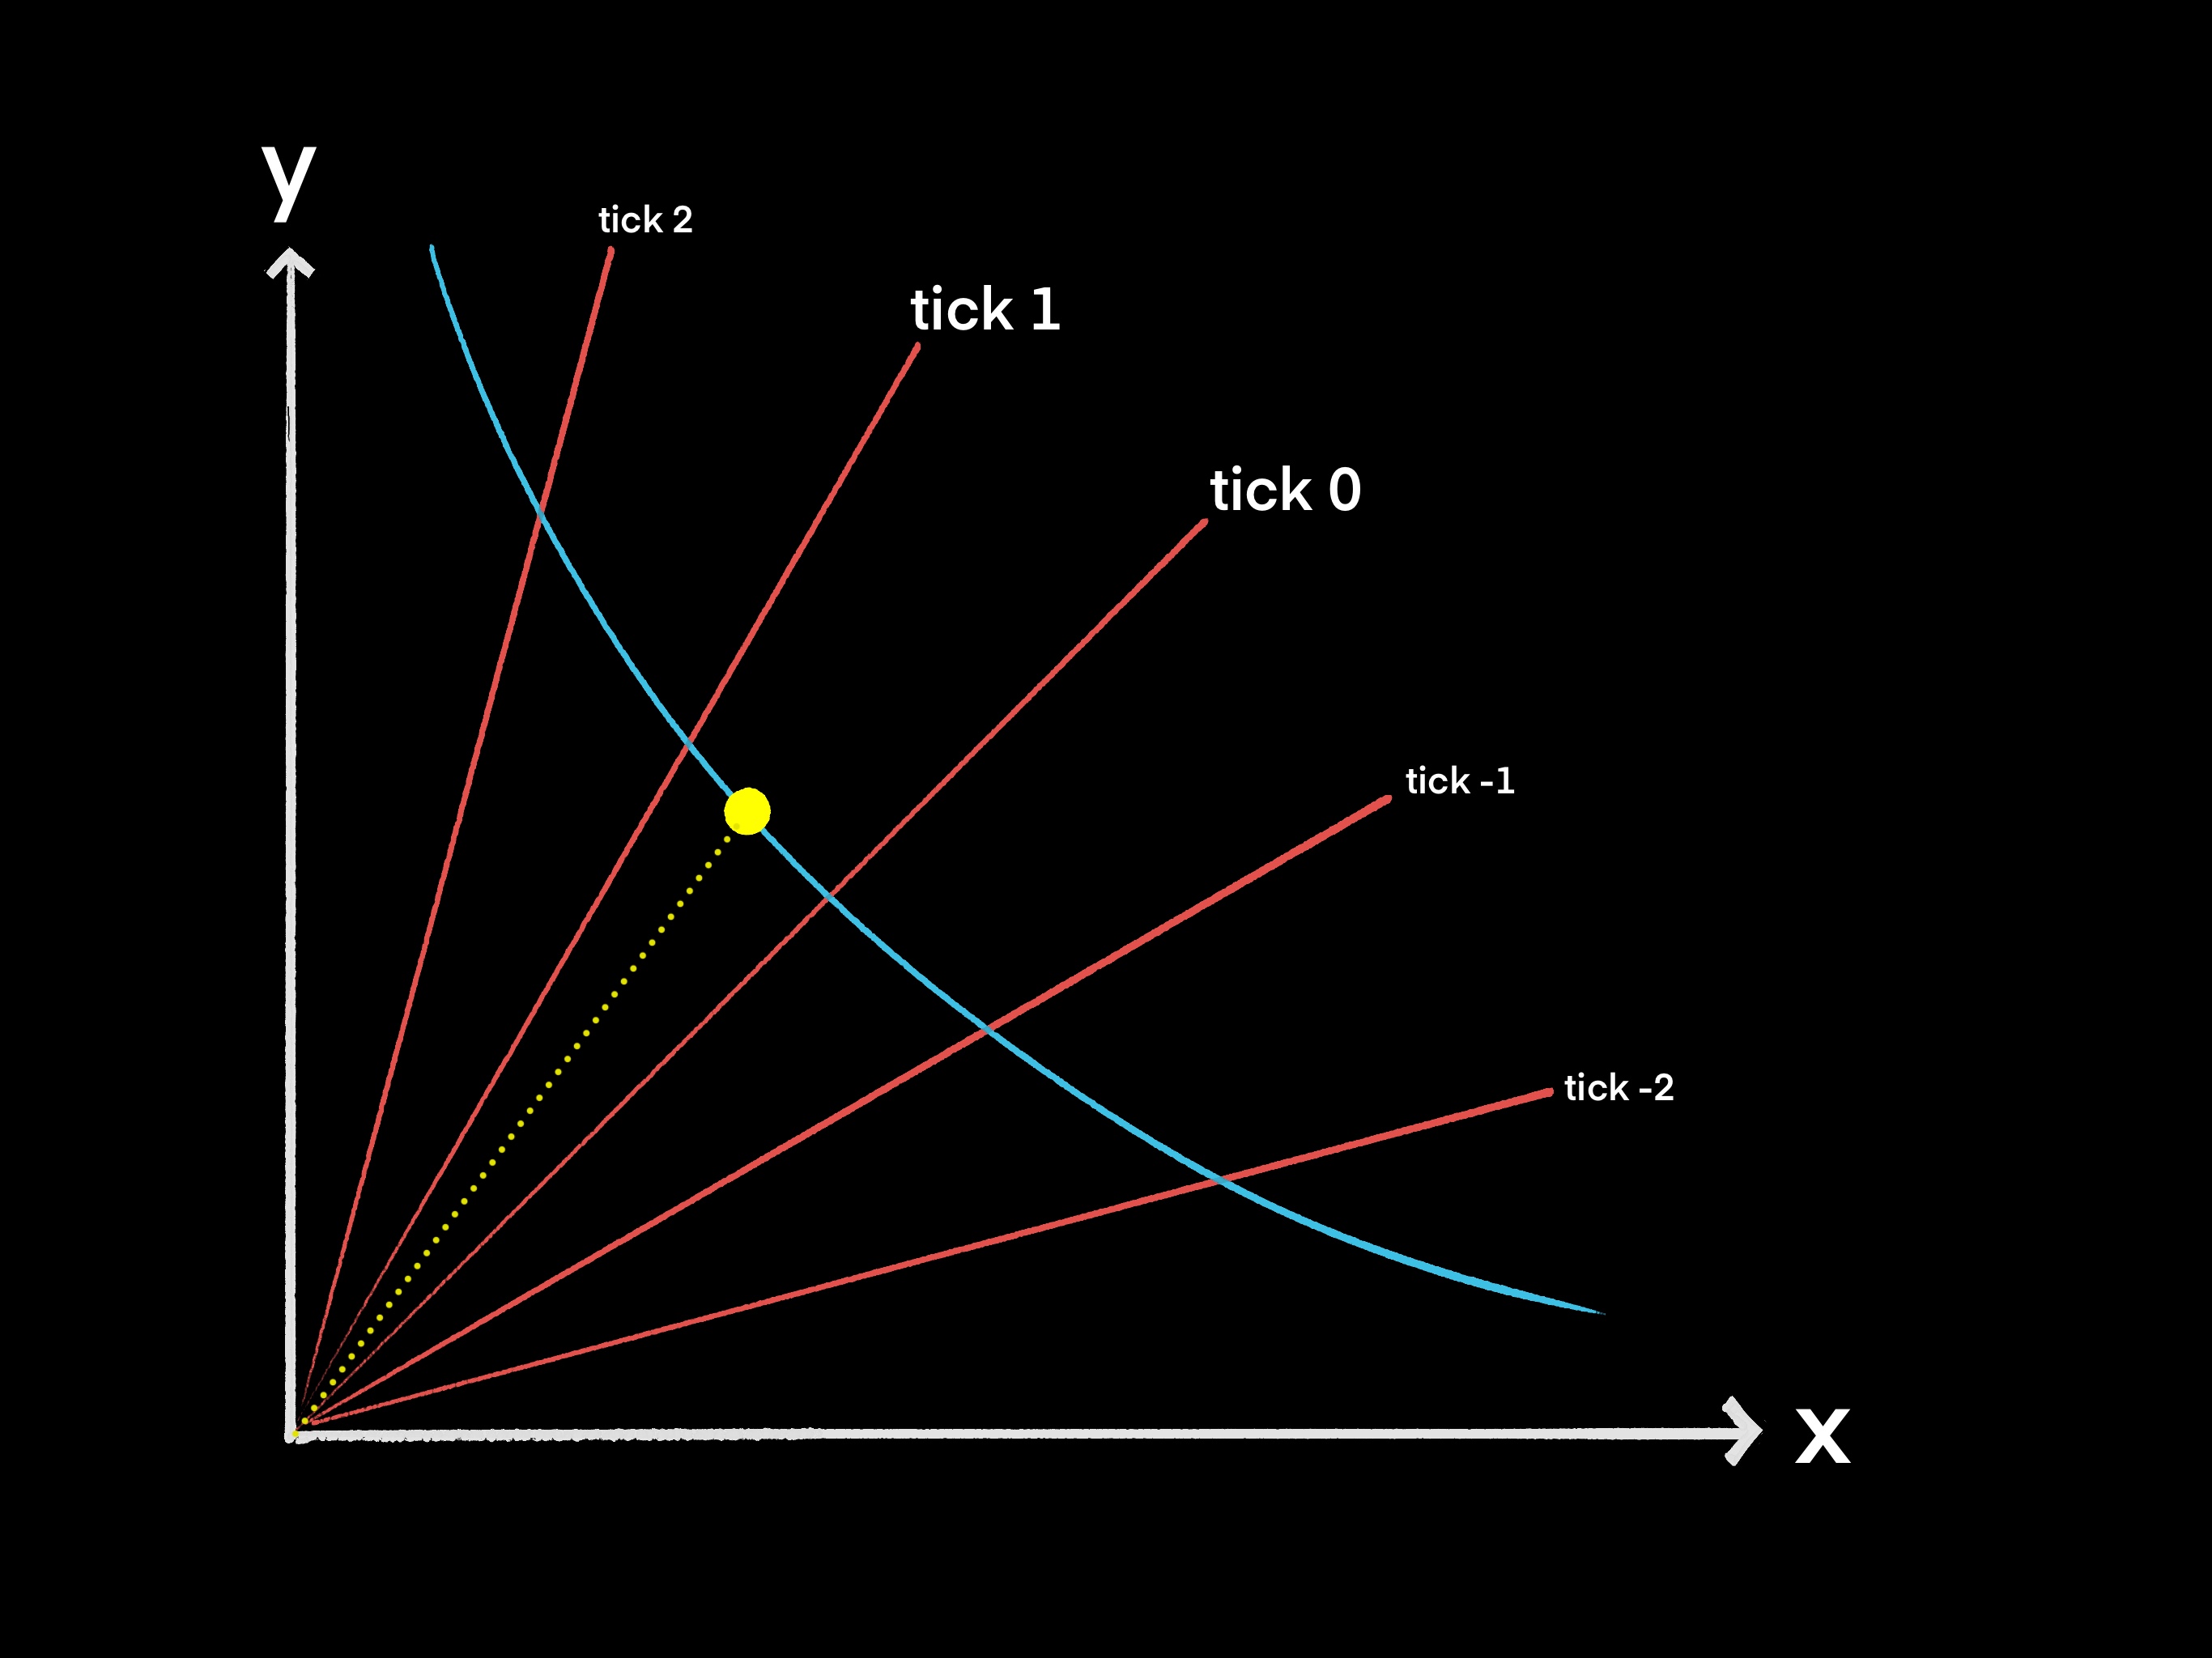
This is perfectly fine — the protocol does not require assets to have a value that matches a tick.
If USDC continued to gain value until 1.0001 USDT needs to be traded for one USDC, then the point on the price curve would land exactly on tick 1. This price lands exactly on tick 1 since .
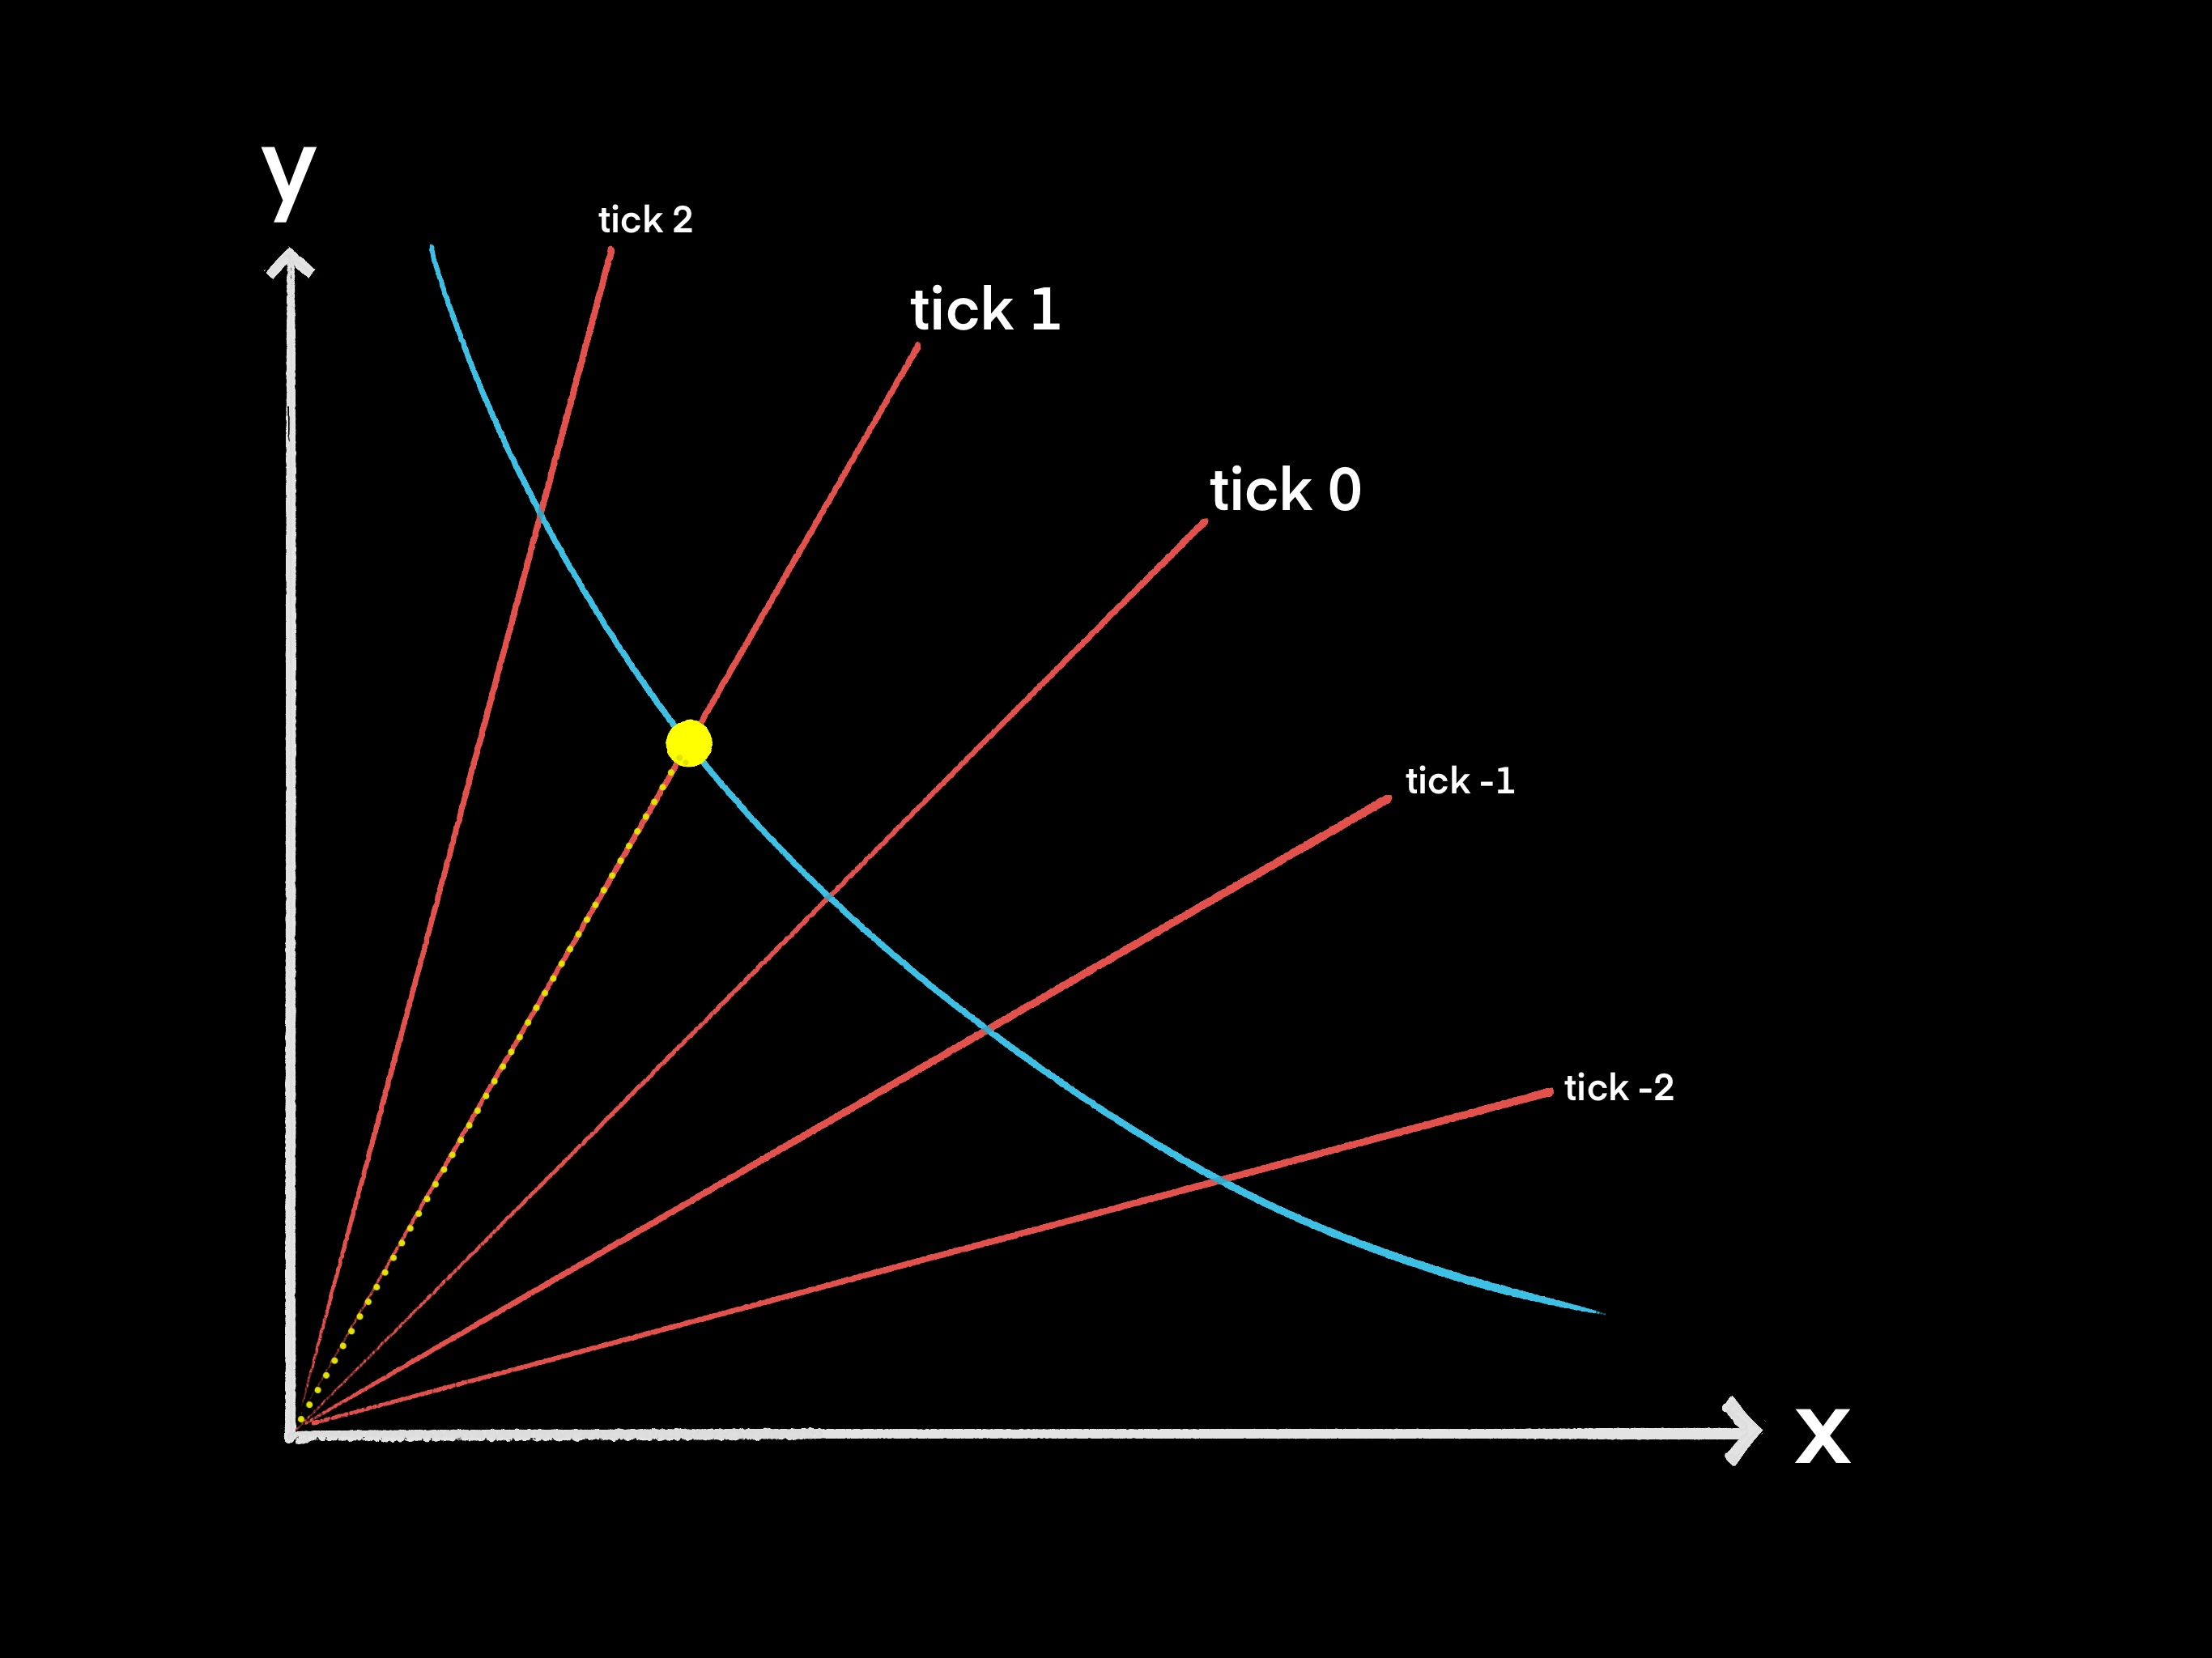
Positive and negative ticks
- If the tick index is negative, this corresponds to a price less than 1, since will be less than 1 if is negative.
- If then the price is 1 (meaning the assets have equal value) because any value raised to 0 is 1.
- If is greater than or equal to 1, then the price will be greater than one.
To see the relationship between negative ticks, tick 0, and positive ticks, see labeled ticks below. Specifically, the image below uses the following example prices.
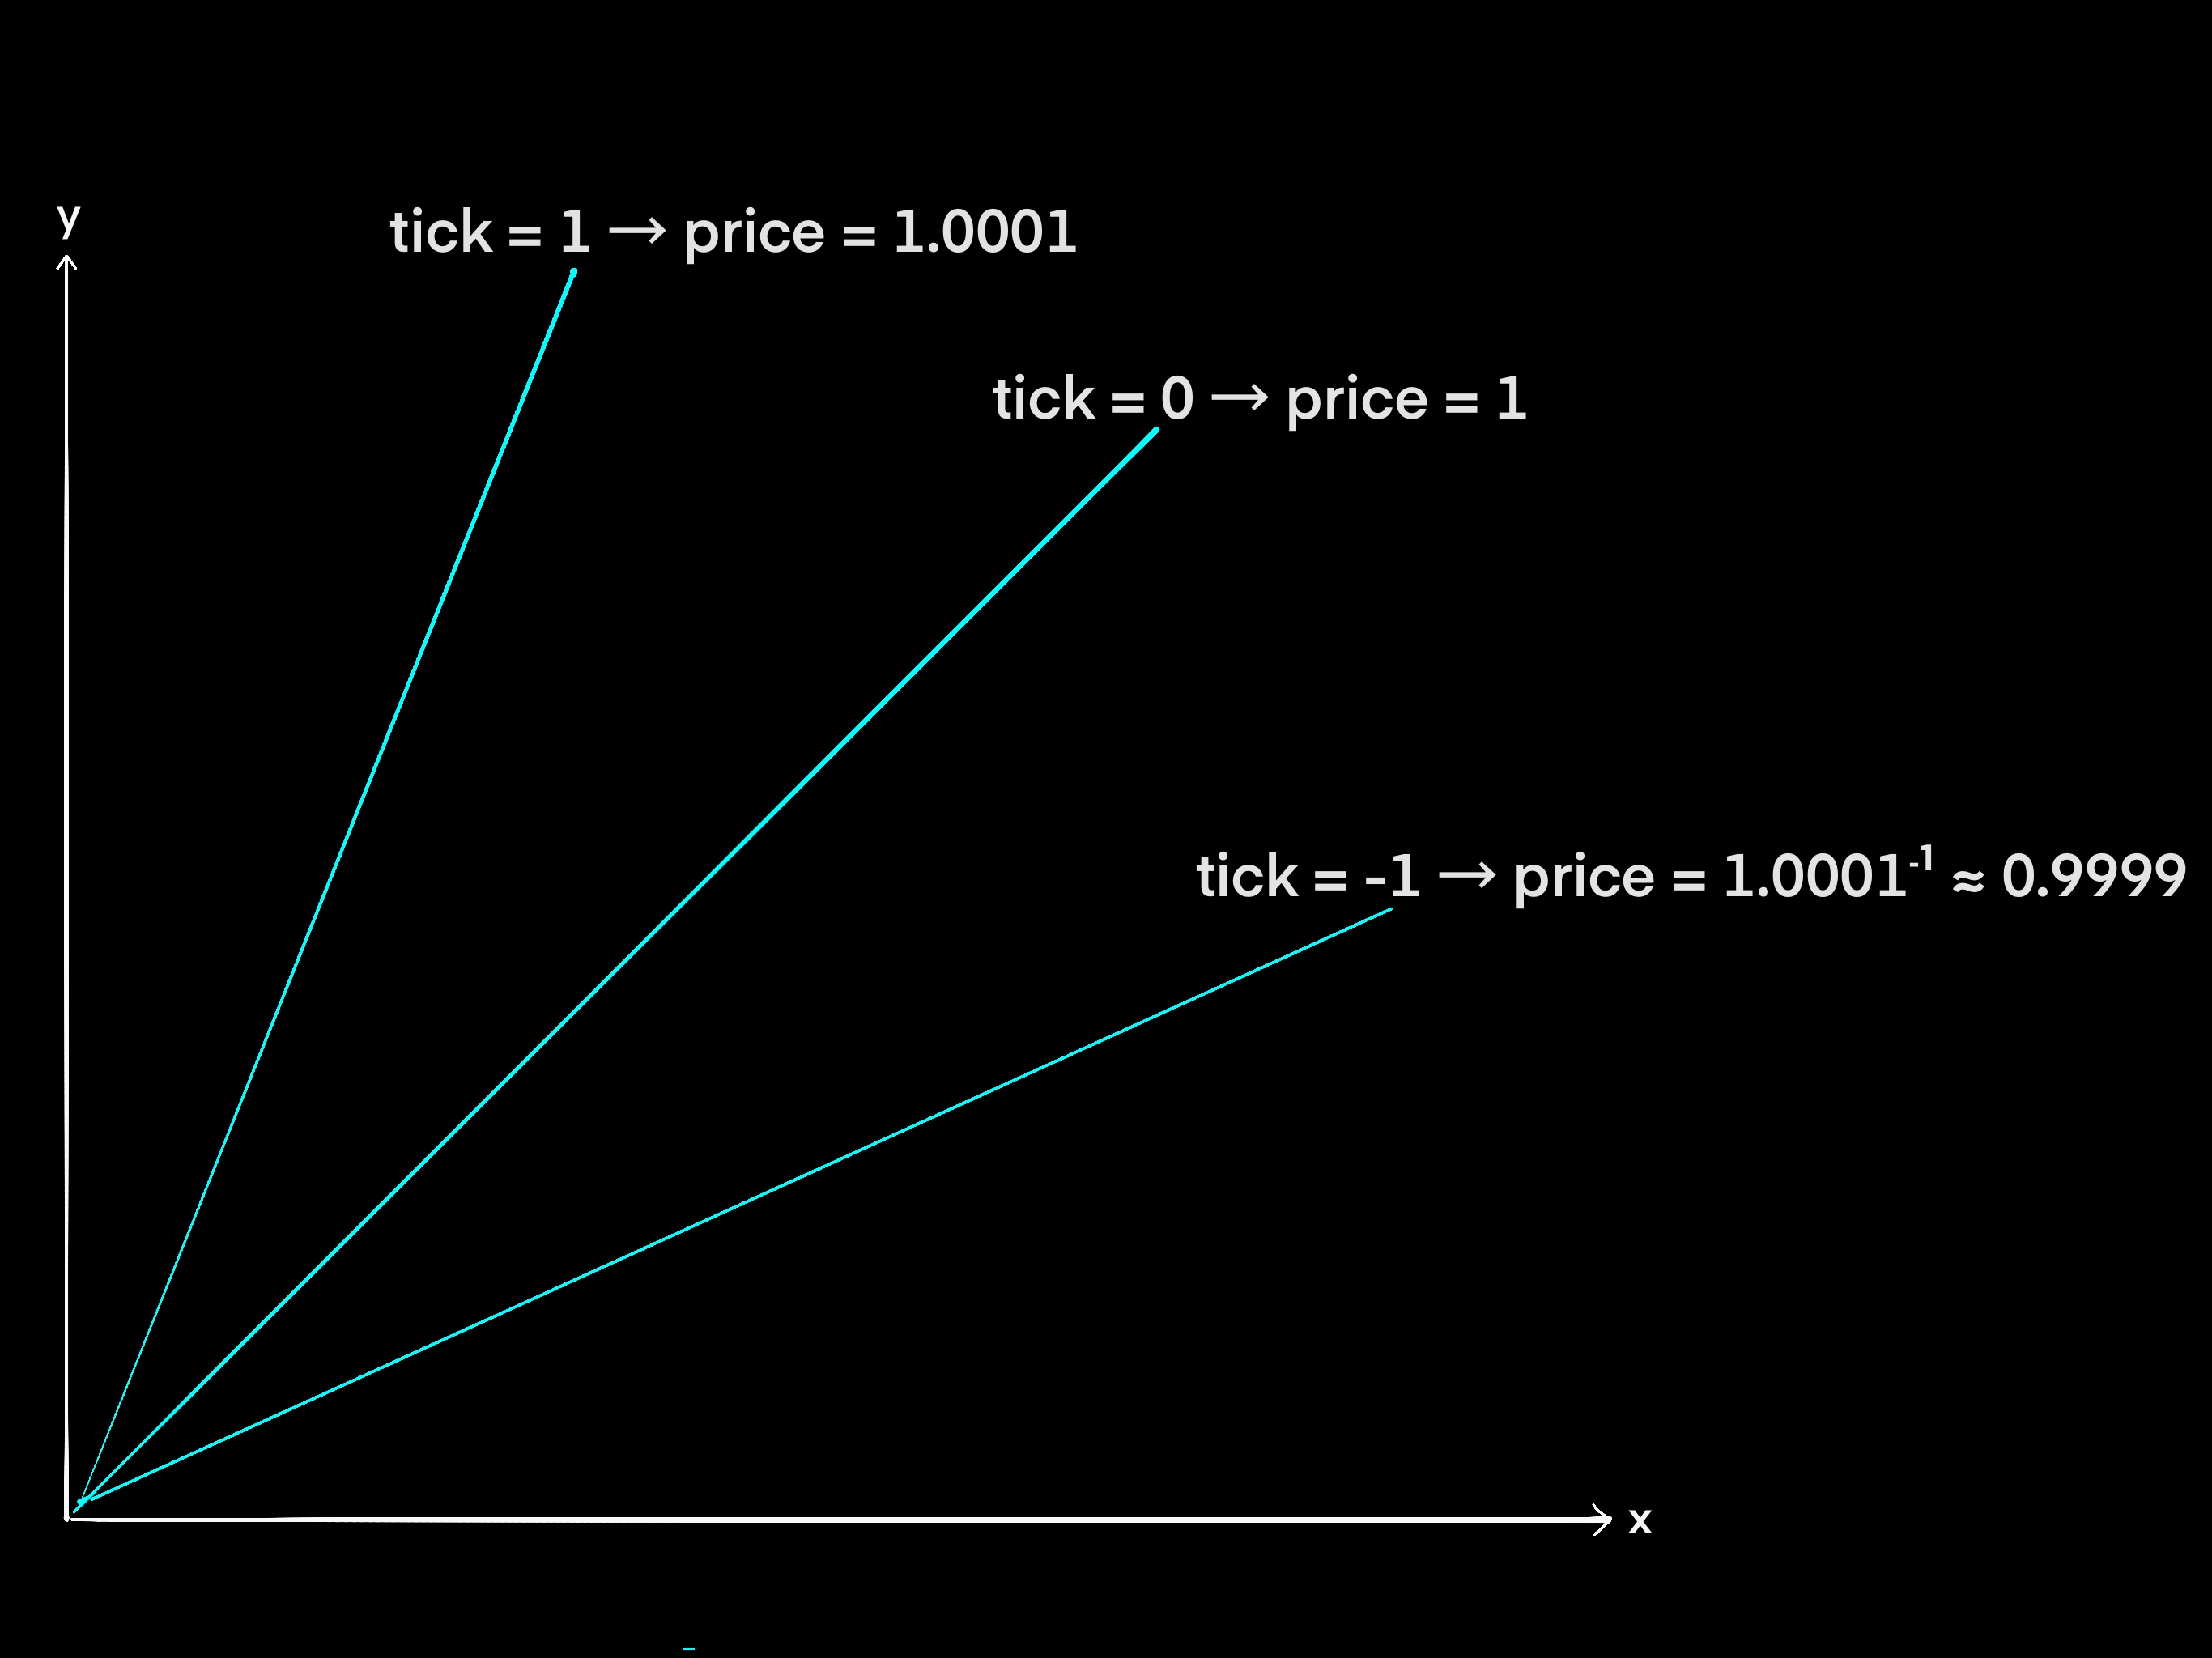
The relationship between token price and ticks
It is common to confuse the price of the token with ticks. As mentioned above, ticks are reference points on the price curve, similar to mileage markers on a road. They are also prices because they are points on the price curve and they are defined by the formula .
The price of a token is its current price: it is a point on the price curve that varies during swaps. For example, the price of a token might be 10 now and 33.2 at some point in the future. As the price changes, it moves along the curve and crosses ticks, much like a car moving on a road crosses mileage markers.
Occasionally, the price of a token will exactly match the price of a given tick, but often, the price of the token will not match any of the ticks. It is similar to a car on a road being momentarily stopped at a point where a mileage marker is located.
How the price of a token is determined through swaps will be discussed over several chapters of this book. What should be clear is that the formula is simply a way of defining the ticks that act as markers on the price curve. They serve as places where, and only where, liquidity can be adjusted.
Why using the value 1.0001 to define ticks?
According to the Uniswap V3 Whitepaper, the value 1.0001 was chosen because
“This has the desirable property of each tick being a .01% (1 basis
point) price movement away from each of its neighboring ticks.”
Using basis points between ticks expresses a relative difference in prices rather than an absolute one.
An absolute difference, such as 0.1 cents, can have vastly different implications depending on the token’s price. For a token worth $100,000, 0.1 cents is negligible, whereas for a token worth 1 cent, it represents a significant change.
In contrast, a difference in basis points ensures the same relative proportion. For example, for a token priced at $100,000, a 1 basis point difference equals $10, while for a token worth 1 cent, 1 basis point equals 0.0001 cents. Although $10 and $0.000001 are different absolute values, they represent the same relative change relative to the token’s price.
Thus, we want the difference between neighboring ticks to be $10 for a token worth $100,000, and $0.000001 for a token worth 1 cent.
Let’s see some examples to see the 1 basis point change between neighboring ticks:
Example 1: Tick 100000 and tick 100001
For tick 100000 and 100001 we have the following prices:
(first four digits were highlighted for clarity). We can see the difference is 2.201545604853891 (approximately 1 basis point or 0.01% of 22015) for a token worth approximately 22015 tokens Y.
Example 2: Tick 10 and tick 11
Now the difference is 0.000100100045012 (0.0001 or approximately 1 basis point) for a token worth approximately 1 token Y.
Tick range
When we write , assuming that and are ticks, we are referring to the price range between and , excluding the boundaries. In this context, is called the lower tick and is called the upper tick.
When we write a tick range as , we are actually referencing , where -10 and 10 are the tick indexes, and and are the corresponding tick prices.
In the illustration below, we see an example of a tick range between and .
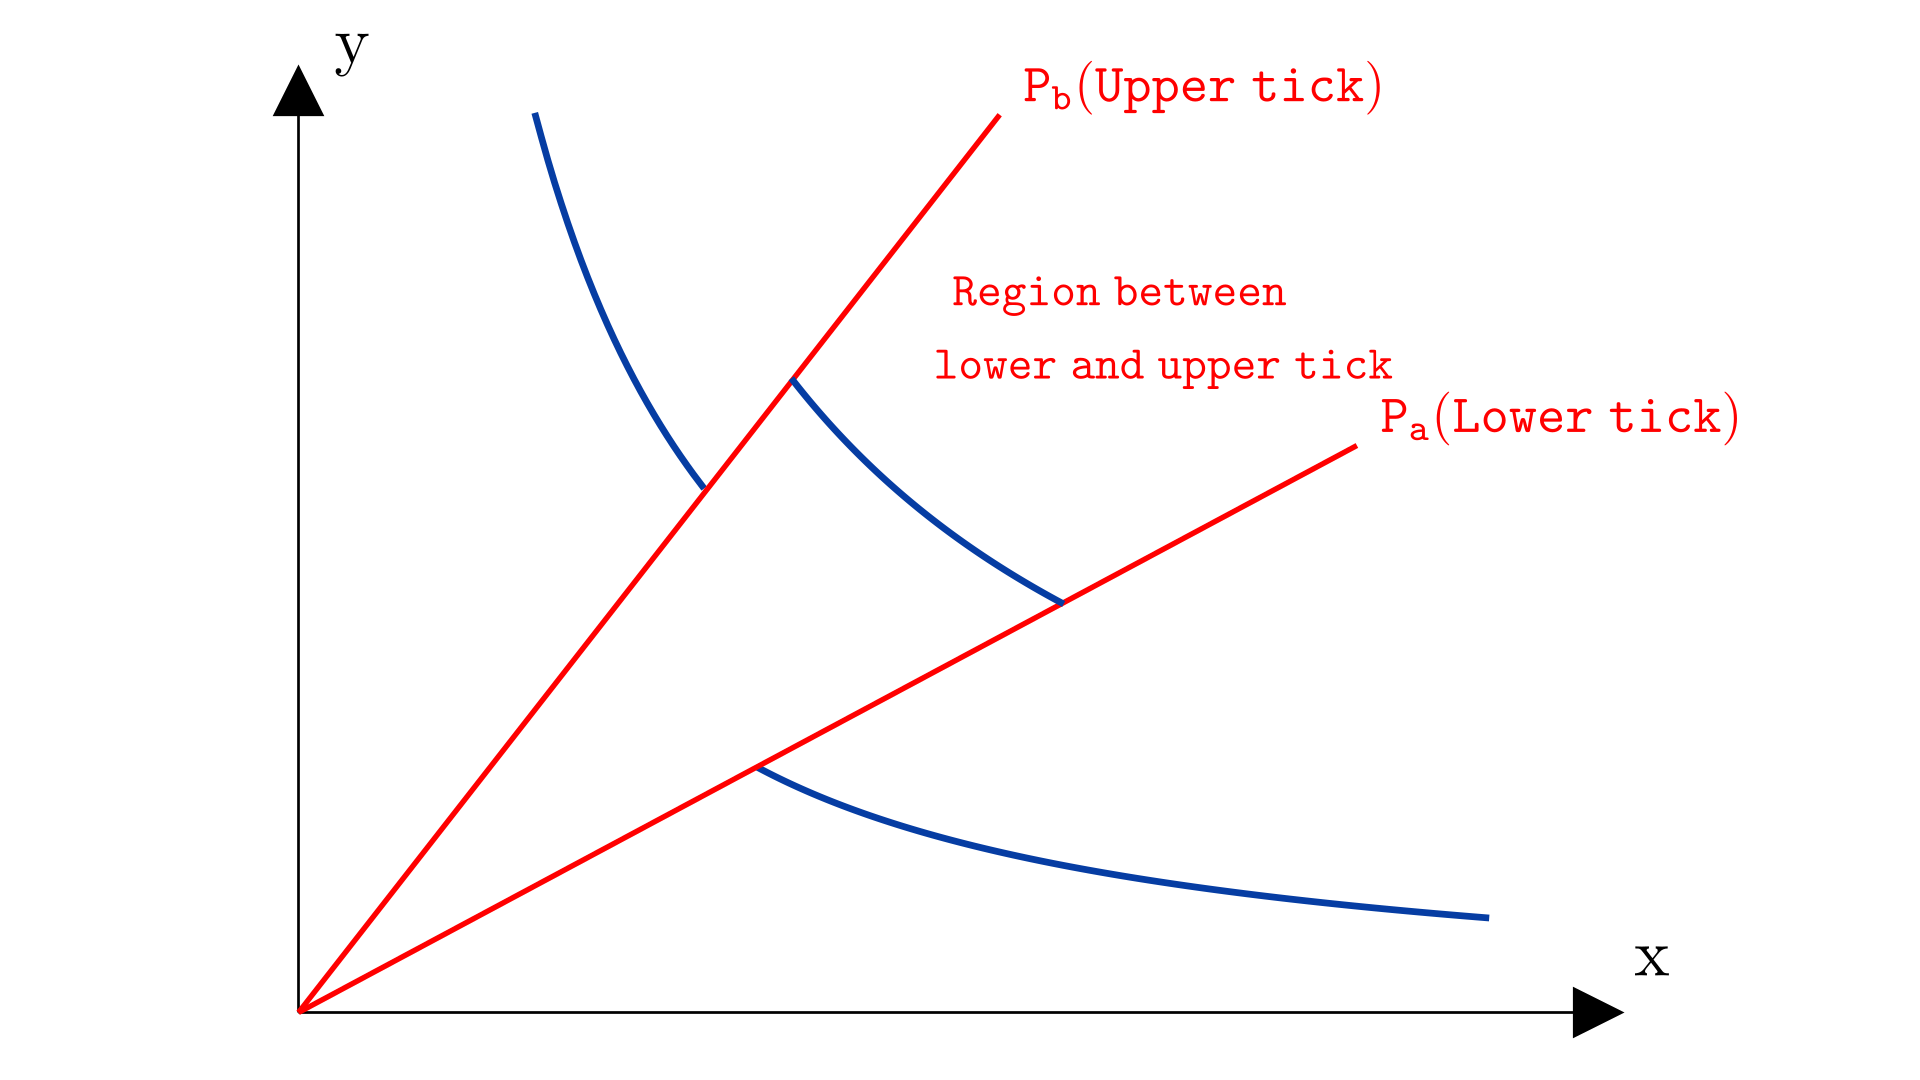
The price curve represented as a line
Another common representation of the price curve is as a line. The price curve is plotted on the x and y axes, while on the number line each point represents a price.
On the curve, an increasing price (of token X) moves up and to the left, while on the line, it increases from left to right:
Thus, we will sometimes represent the price and liquidity of curve using the line diagram below, where the blue area represents the liquidity contained in the tick range.
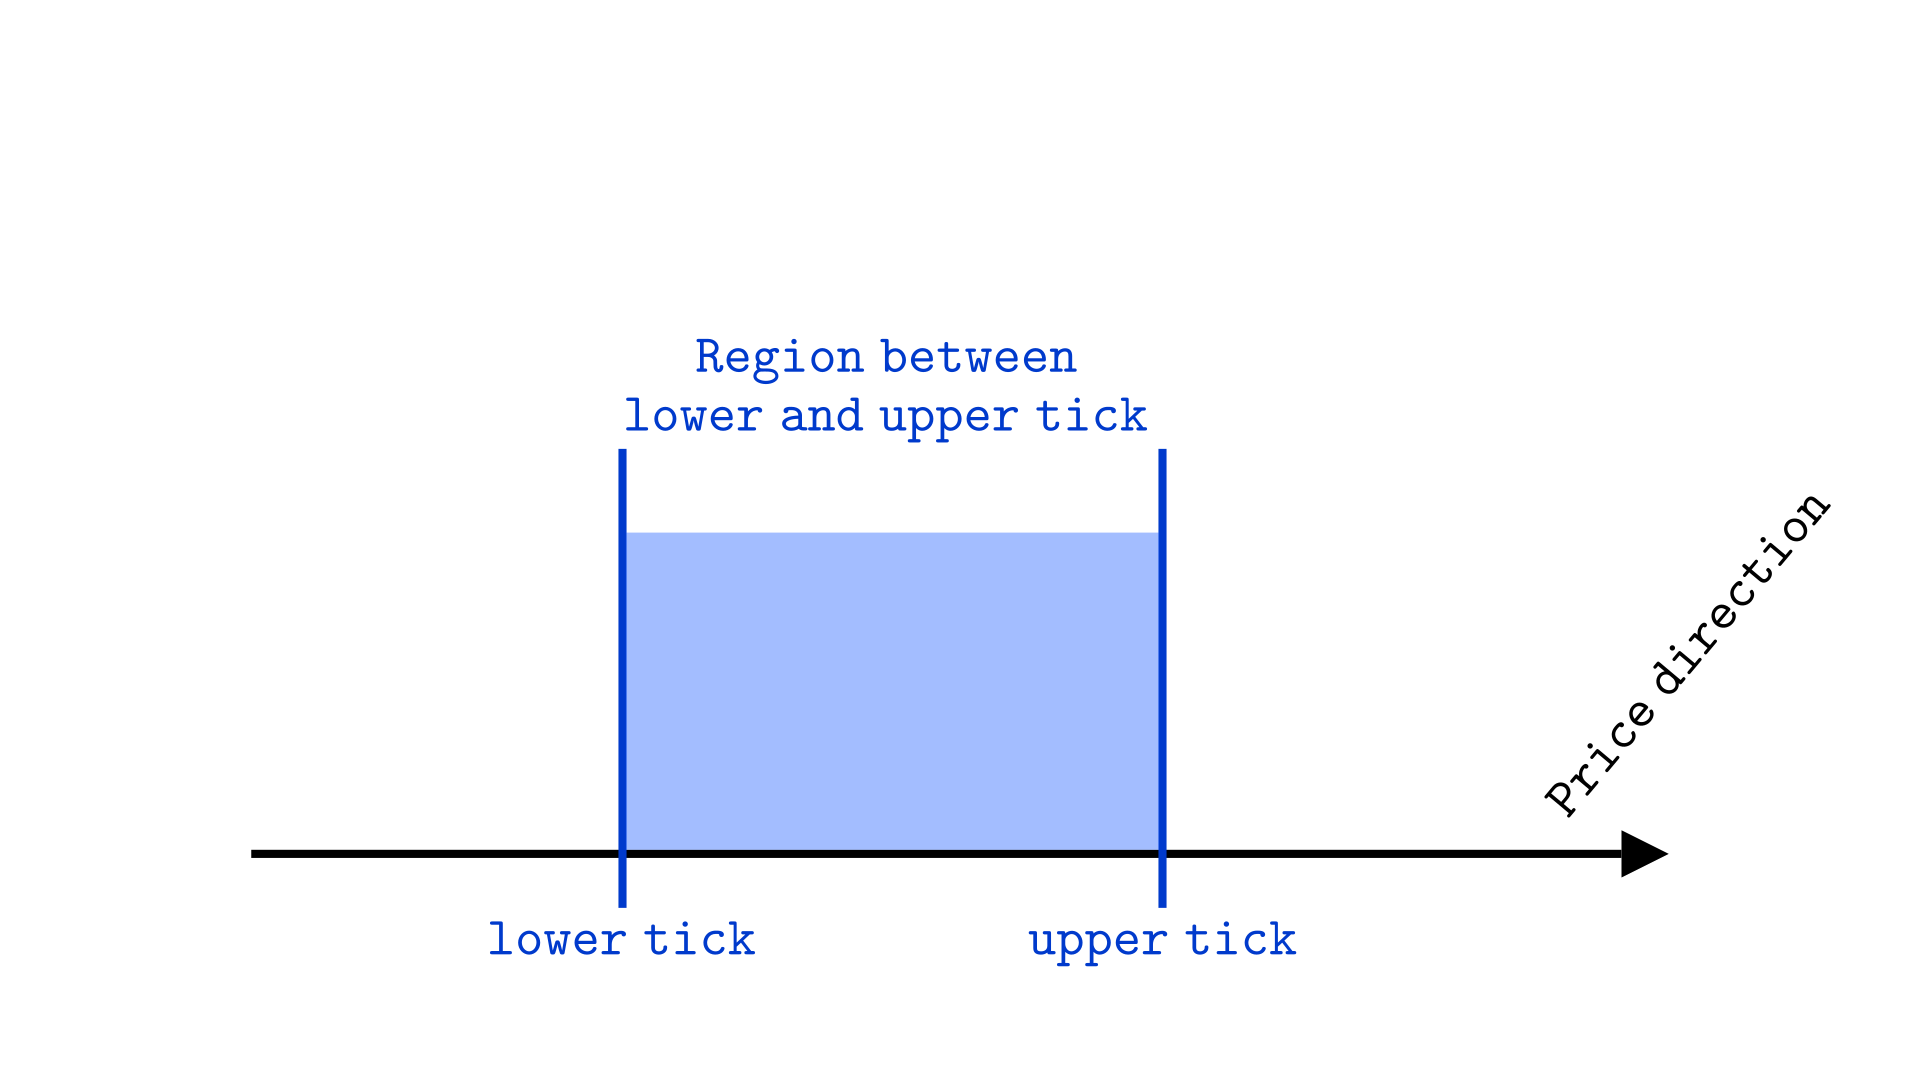
We can plot the liquidity level on the corresponding line plot as follows:
Below is an interactive tool to further illustrate how these two representations show the same information. Change the liquidity of a price segment by moving the k sliders, then click “Sweep Price.” After clicking Sweep Price, a price indicator for both charts (a red ray for the cartesian plot and a red dot for the line plot) will appear. Note how the red ray on the Cartesian plot tracks the red dot on the line plot.
We expect the reader to understand both representations of the price curve: one on the Cartesian plane (x-y axis) and the other as a line. Both diagrams will be used to explain concepts throughout the chapters.
The meaning of the x-y axis in v3
In Uniswap V2, the value of x is the literal amount of token X (the reserves) held by the pool (same for y). However in Uniswap V3, “reserves” are a more complicated concept because each curve segment holds different amounts of token X and/or Y.
It is still helpful to think of the x and y axes as measuring “amount” of tokens, but there is a quite a bit of nuance to what this “amount” is, so we defer discussion to a later chapter. We mention this so that the axes are not misinterpreted as the price of a token, since simply labeling an axis “x” could be ambiguous without clarification.
The current tick
Uniswap V3 keeps track of the “active tick” or “current tick” or sometimes just “tick.” The “current tick” is the current price rounded down to the nearest tick. If the price increases and crosses a tick, then the tick that was just crossed becomes the current tick. “Crossed” doesn’t require that the price “passed over” the tick. If the price stops on the tick, the tick is considered crossed.
If the price decreases and crosses a tick, then it must have crossed the prior current tick, so the tick below that tick becomes the new current tick.
The interactive tool below illustrates how the protocol selects a tick as the current tick. Move the slider at the top of the tool to see how ticks (gray) become the current tick (green) as the price crosses the tick:
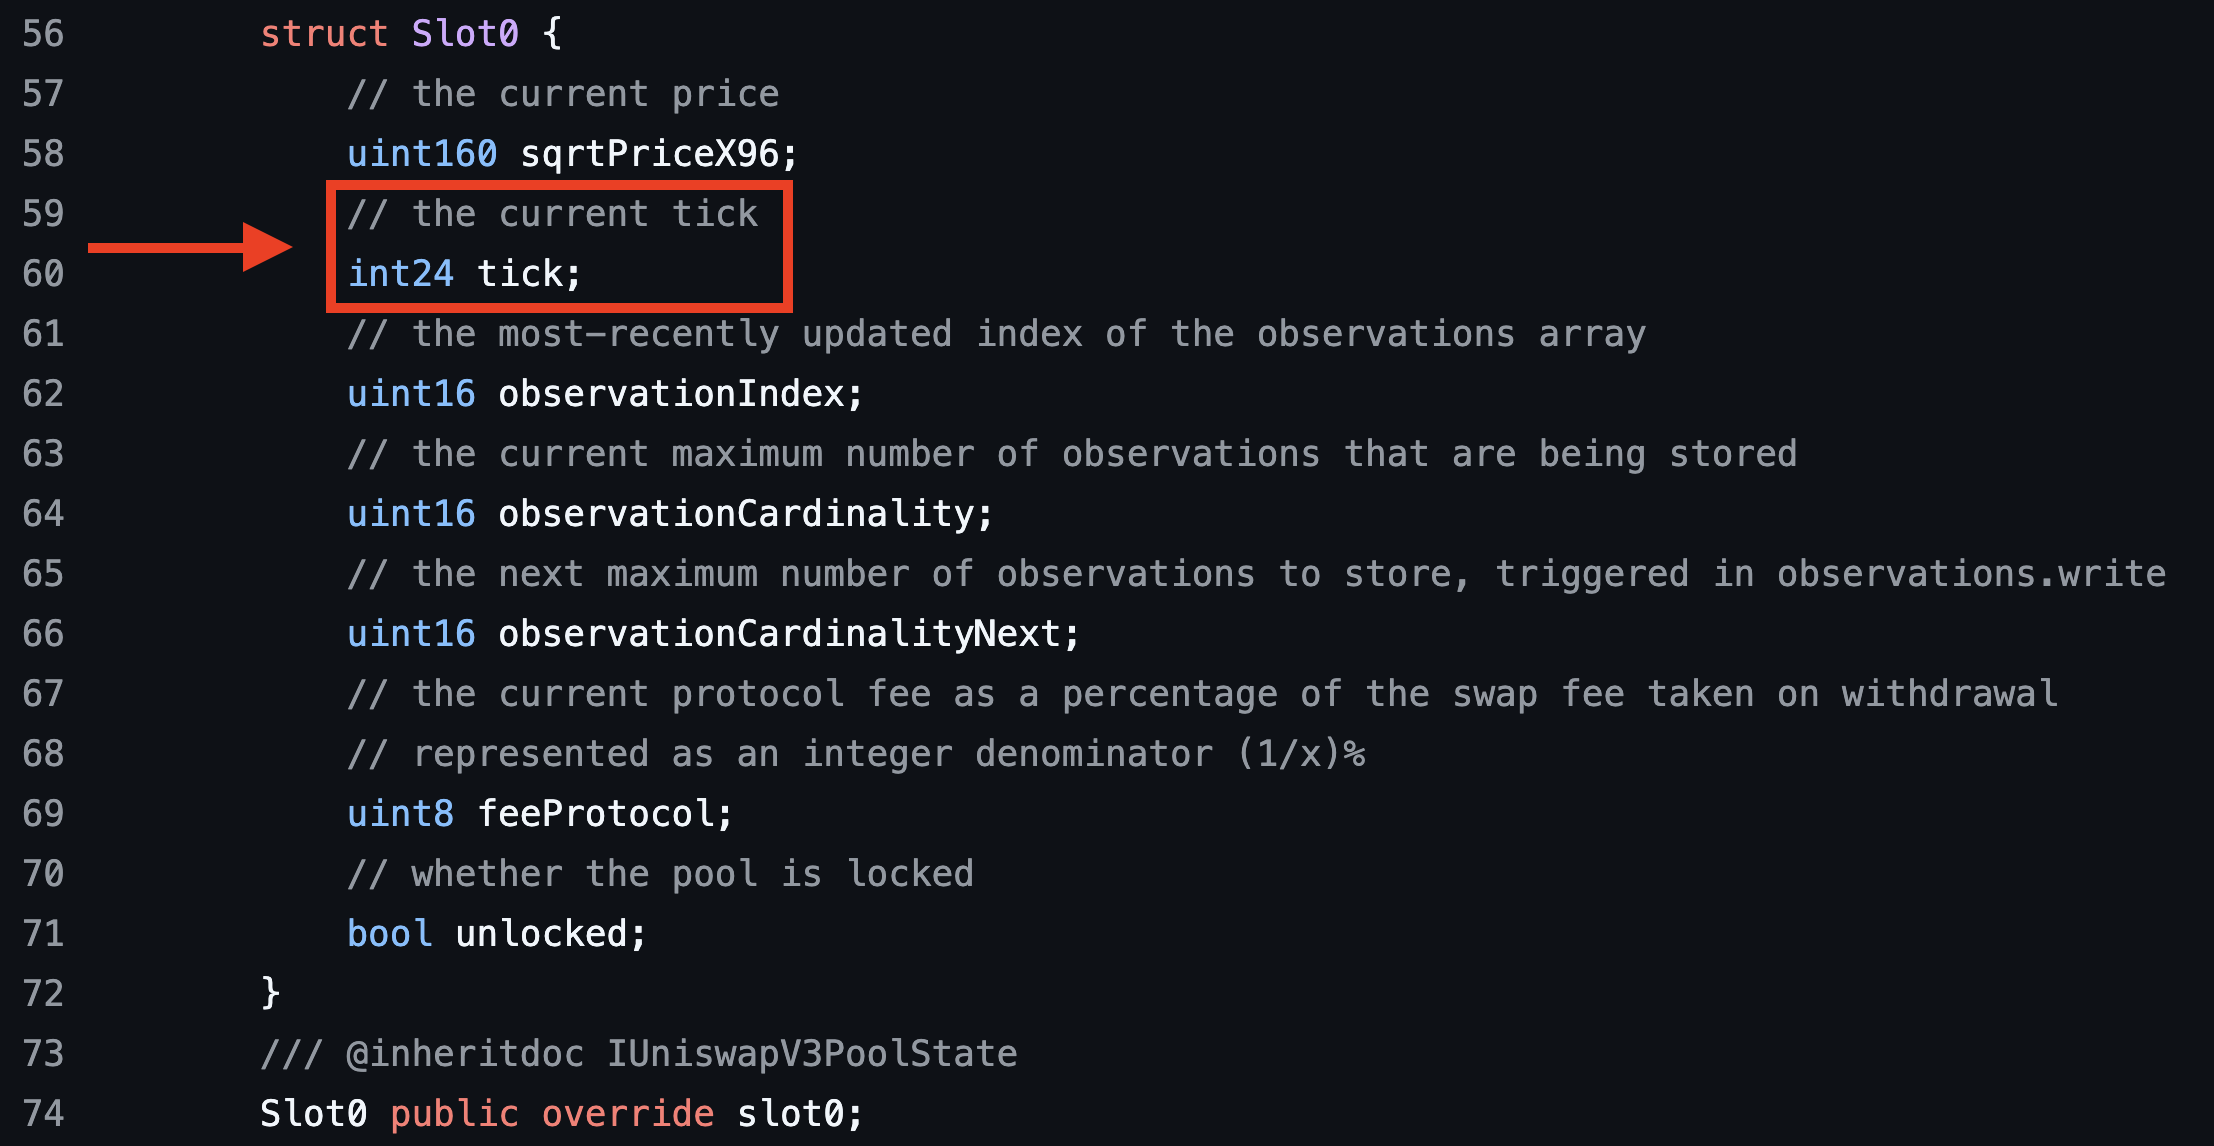
The slot0 variable holds the current tick
The protocol stores the current tick in a struct named slot0 (code link). This variable is public, so anyone can read the current tick of a pool directly on Etherscan by querying slot0.
Below we show the result for the ETH:DAI pool on Base:
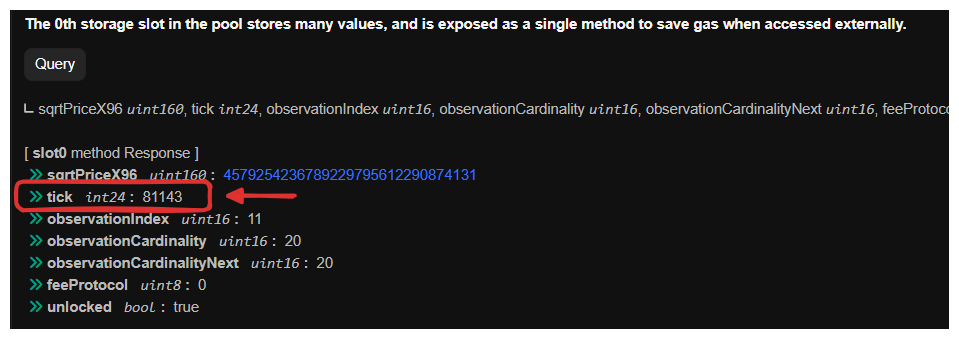
The current tick is 81143. The pool is ETH:DAI, so the price is expressed as Ether in terms of DAI. Both tokens have 18 decimal places. Calculating the price at tick 81143 gives . The current tick is the current price rounded down to the closest tick. Therefore we can assume that the current tick roughly corresponds to the current price. So for this pool, 1 ETH is worth approximately 3340 DAI.
How decimals affect price
Let’s consider another example to illustrate how decimal places affect price and tick. Below we show the result for the ETH:USDC pool on Base:
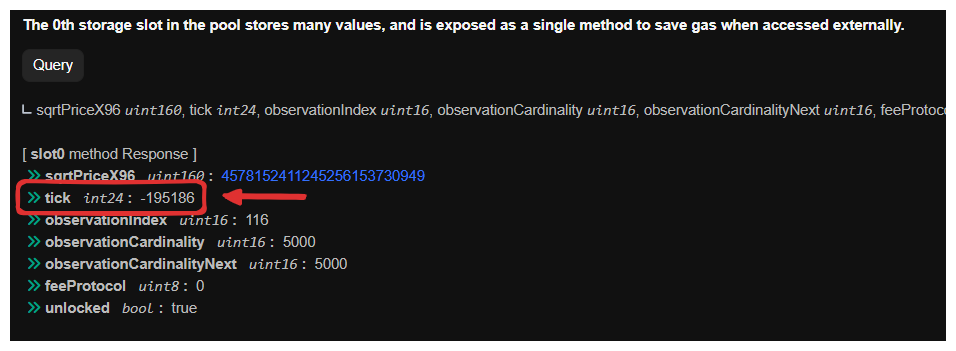
The tick is now negative with a value of -195186, and the price can be calculated as . The tick is negative here due to the difference in decimal places, as ETH has 18 decimals while USDC has only 6 decimals.
Assuming ETH is worth $1000, the smallest unit of ETH is worth (or ), while the smallest unit of USDC is worth . So, although we assume that 1 ETH is “worth” more than 1 USDC, considering its smallest unit, 1 smallest unit of USDC is worth more than 1 smallest unit of ETH.
In this example, to account for the difference in decimal places (18 for ETH vs 6 for USDC), we need to multiply the price by . Thus, the price of the pool becomes , which is approximately the same value as in the ETH:DAI pool.
Summary
- The price curve is demarcated with points called ticks, defined by the formula , where is named tick index. Ticks represent a set price.
- Ticks serve as boundaries where the liquidity provider can provide liquidity. It is not possible to provide liquidity with arbitrary points as boundaries.
- Ticks can be positive or negative. Tick zero corresponds to the scenario where the tokens have the same value. Positive ticks correspond to prices where one unit of X can be swapped for more than one unit of Y. Negative ticks correspond to prices where swapping in one unit of Y will get back more than one unit of X.
- The current tick is the closest tick to the current price rounded down.
- The minimum and maximum ticks are -887,272 to 887,272. We will discuss why in the next chapter.
Practice Exercises
Chose a pool on a low cost L2 and provide liquidity. The list of pools are here. Take note of where you can and cannot provide liquidity.